Mat Hope
27.10.2014 | 2:00pmThe US’s shale gas boom is credited with helping the country cut power sector emissions 16 per cent since 2007. Official figures released earlier this week suggest a switch from coal to gas was largely responsible for the drop.
But there are competing theories. Last week, Greenpeace released analysis with the headline ‘Renewables cutting US emissions more than gas as coal consumption drops’. Business Green and Thinkprogress reported the finding, amongst others. So why are the US’s emissions falling?
Fuel ‘switching’
Figuring out why the power sector’s emissions change is quite hard, and relies on lots of assumptions about how the energy market works.
The US gets power mainly from coal, gas, renewables and nuclear. By analysing changes in this mix, it should be possible to work out how switching from one fuel to another affects emissions.
Data from the US’s Energy Information Administration shows how much power each fuel generated over a particular timeframe.
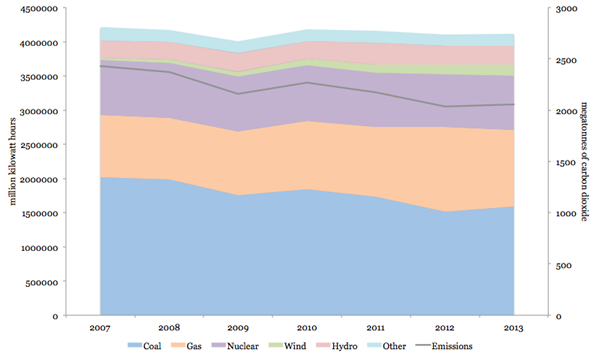
The graph shows coal generation fell by about 430,458 million kilowatt hours between 2007 and 2013 (the blue chunk). At the same time, gas generation increased 217,075 million kilowatt hours (the orange segment). Wind generation (green) also increased a bit, although much less than gas. At the same time, emissions from the power sector dropped significantly, as the grey line shows.

Source: Energy Information Administration data. Graph by Carbon Brief.
Gas emits roughly half the carbon dioxide that coal does when it’s burned to produce power. So if gas is being used instead of coal, that would lead to lower emissions. If we assume a straight swap, that would mean 217,075 million kilowatt hours of coal power was replaced by gas power, and we can work out the emissions savings accordingly.
But the reality is more complicated. In 2012, coal, hydro and nuclear power decreased, and gas and wind power increased. If gas was used instead of low carbon energy sources like renewables or nuclear, then rather than reducing the US’s emissions it may have added to them.
So how do you know which fuel replaced which?
In short, you don’t. So analyses make a range of assumptions about which fuels displace others. It’s partly the differences in these assumptions that explain the big discrepancies between estimates of the emissions saved by fuel switching, according to US thinktank the Breakthrough Institute (BTI).
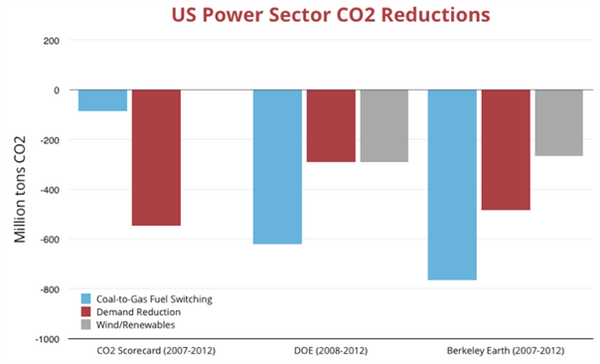
BTI compared three studies examining fuel switching. The first, by campaign group the CO2 scorecard, assumes any decrease in renewable power in the US was down to increased gas use. That means it calculated that gas was responsible for smaller emissions savings (the blue bars) than the other two analyses, from the US Department of Energy and the University of California, which assume gas predominantly displaced coal.

Source: The Breakthrough Institute. Note, the Department of Energy’s analysis does not make estimates of the relative contribution of demand reduction/renewables, so the Breakthrough Institute has represented them equally here.
Reality is more complex
So which set of assumptions is most likely to reflect reality?
Wind power’s growth probably has reduced demand for fossil-fuelled power, as it means coal and gas power stations can be run at lower levels of output. But it’s hard to know whether wind has specifically displaced coal.
It’s probably more likely that wind has replaced gas. That’s because coal is mainly used for what’s known as baseload generation: providing a certain amount of power to the grid around the clock. In contrast, gas and wind are more likely to be used when there are spikes in demand – like when people get up in the morning and make a cup of coffee – as they can be ramped up relatively quickly and cheaply.
Fuel prices also have a large part to play. Gas has been cheap in the US because of the fracking boom, making it popular with energy companies.
But working out how the complex economics of the energy sector affects the power mix is beyond most models that look at fuel switching.
Dealing with demand
It’s not just the US’s fuel mix that has changed in the last few years. Electricity demand also dropped.
The US used 98,000 fewer million kilowatt hours of electricity in 2013 than in 2005, mainly because of the economic downturn.
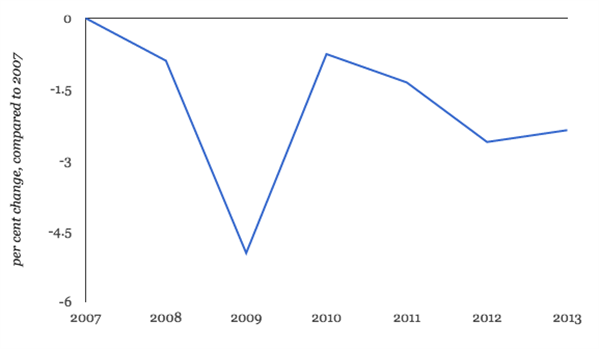
This graph shows how electricity demand decreased significantly in 2009, when the recession hit:

Source: US electricity generation, 2007 to 2009. Data from Energy Information Administration. Graph by Carbon Brief.
This is where it gets complicated. Greenpeace’s analysis suggests 30 per cent of the emissions savings between 2005 and 2013 were due to changes in “end-use efficiency”.
BTI criticised Greenpeace for including the impact of the recession in this category. The author of Greenpeace’s analysis, Lauri Myllyvirta, tells Carbon Brief such criticism is largely fair, and a better label for that category may be “absolute demand reduction”.
Looking at it this way, the economic crash has been the main driver of the US’s emissions savings, not a shift to gas or wind power.
Power plants have also become more efficient, burning less fuel to generate the same amount of power. Greenpeace’s analysis acknowledges this. But it doesn’t attribute the emissions saved as a consequence of coal and gas power plants’ improvements to the fuels they burn, as some other analyses do.
BTI says this is unfair. It argues that many new, more efficient, gas power plants were built due to the availability of cheap gas. So the emissions saved as a consequence of power plants becoming more efficient should be attributed to gas.
If the emissions saved through power plant efficiency improvements are added to those saved from a switch to gas, Greenpeace’s headline finding is no longer correct – accounting for the effect of power plant efficiency, their analysis would then suggest that 35 per cent of the US’s emissions were saved by switching to gas combined with power plant improvements, compared to wind generation saving 32 per cent.
Tweaking models
The US’s shale gas boom has clearly had a significant impact on the power sector’s carbon dioxide emissions (although there continues to be disagreement about what other emissions fracking might produce.)
But the emissions cut is clearly not just down to burning a different type of fossil fuel. Renewables and falling demand are also important, with their impact often overlooked in favour emphasising the effect of US’s switch to gas.
Given the complexity of the energy market, it’s probably prudent not to pin responsibility for falling US emissions on a single factor. But it would also be unwise to underplay the impact that moving from coal to gas is having on the world’s second-largest emitter.
You can find the data behind Greenpeace’s original analysis in this spreadsheet.
Update, 04/11/14: The units were updated from terawatt hours to million kilowatt hours.

