The EU wants to insulate itself against the risk of energy supply disruption. The crisis in Ukraine has heightened the sense of vulnerability, particularly for those countries in the eastern EU that rely heavily on Russian gas.
In a 237-page background paper the European Commission has explored recent and expected future trends to see how greater energy security could be achieved. Here are five graphs that give you a flavour of what it says.
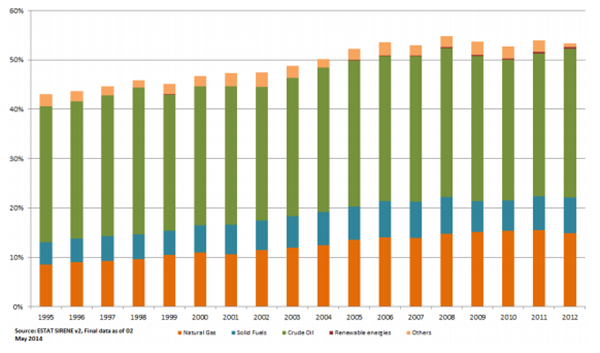
1. The EU is becoming less energy independent, particularly for gas.
This chart shows that energy imports have accounted for more than half of total EU energy demand since 2005. The growing orange bars at the bottom are for gas. The large green bars are for oil. The blue-green chunk is for coal. The small slivers at the top are for other types of energy imports.

2. The EU is producing fewer fossil fuels
Fossil fuel production in the EU has declined dramatically since the mid-1990s. Gas production fell by 30 per cent between 1995 and 2012 (below left) and coal production by 40 per cent.
The decline was particularly rapid for oil as North sea production started to dry up (below right). EU oil production has halved in the decade to 2012. The UK is still the biggest producer but its share of EU oil production is down from four-fifths to three-fifths of the declining total.

3. But the EU is using less energy too
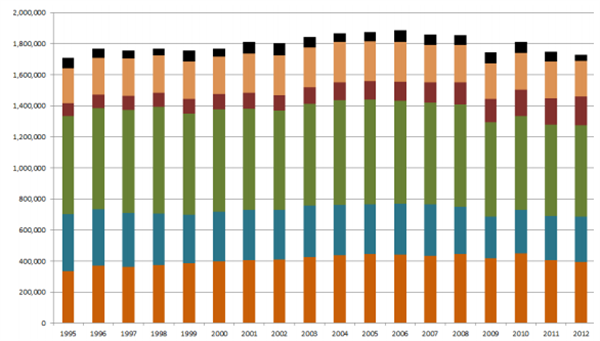
The EU is using less energy than it used to, particularly since the 2008 financial crisis, as shown in this chart of total EU energy consumption in kilotonnes of oil equivalent (below).
Oil consumption is now falling by nearly 3 per cent per year (green bars). Coal consumption has also dropped (blue-green). Consumption of energy from gas (orange) and nuclear (peach) has remained fairly steady. Renewable energy (red) has provided a growing share of the declining demand.

4. Renewable energy production is rising fast from a low base
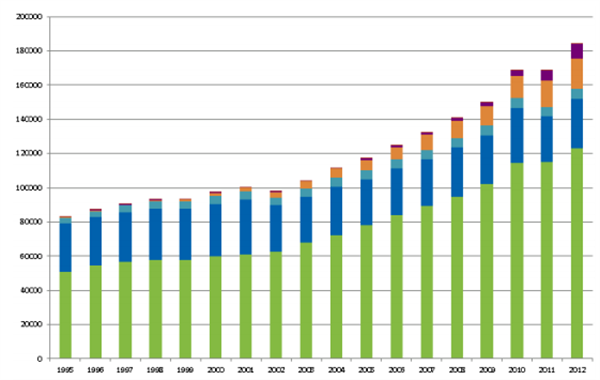
The amount of energy produced in the EU from renewable sources has risen fast. The chart below shows it has more than doubled between 1995 and 2012 to around 180,000 kilotonnes of oil equivalent. That’s about 10 per cent of total EU energy demand.
Biomass energy such as wood burning accounts for the largest share of renewable energy production by far (green bars), with hydropower second (blue). Wind (orange) and solar (purple) are also growing fast, but from a tiny base.

5. Overall the amount of energy imported is in decline
EU imports of energy are below the peak seen before the 2008 financial crisis. Falling EU fossil fuel production is being outweighed by declining energy demand and rising levels of energy production from homegrown renewables. The chart below shows recent (blue) and expected (red) net energy imports measured in kilotonnes of oil equivalent.
Under business as usual energy imports are expected to decline by 10 per cent in 2020 and 17 per cent in 2030 compared to 2012 levels (first and second red bars on the right).

The EU’s efforts to boost energy security are intimately connected to its planned climate and energy policy package out to 2030. The European Commission has proposed targets to cut emissions by 40 per cent of 1990 levels by 2030 and to increase renewables’ share of energy supply to 27 per cent.
These targets would reduce reliance on imports by 24 per cent against 2012 levels (red bar, far right). A higher renewables energy target and binding targets to cut energy demand would cut the need for energy imports even more.

