Sea level research says only a ‘brief window’ to cut emissions
Robert McSweeney
02.08.16Robert McSweeney
08.02.2016 | 4:00pmAs global temperatures rise, scientists know that sea levels will follow suit. Today, global sea level is the topic of two new papers, both published in Nature Climate Change.
The first looks at Antarctica’s ice shelves – known as “gatekeepers of the ice” – and how much ice each one can afford to lose before opening the gates to more glacier flow into the oceans.
The second study focuses on how our greenhouse gas emissions today could lead to tens of metres of sea level rise that persist for hundreds of thousands of years.
Rapid thinning
An ice shelf forms when glaciers on land reach the coast and flow into the ocean. If the ocean is cold enough, this ice doesn’t melt. Instead it forms a permanently floating sheet of ice.
Ice shelves surround three-quarters of Antarctica. They can be as much as two kilometers thick and the largest – the Ross ice shelf – is roughly the same size as Spain.
These floating tongues of ice provide the important function of holding back – or “buttressing” – the flow of ice from the glaciers behind them into the ocean.
But many of Antarctica’s ice shelves are thinning rapidly. When an ice shelf thins, retreats or even collapses, it is less able to hold back the glaciers behind it, allowing more ice to flow from land and into the sea, and adding to sea levels. After the collapse of Larsen B ice shelf in West Antarctica in 2002, for example, some glaciers started flowing eight times faster.
The new paper estimates how much of each of Antarctica’s ice shelves can be lost without saying goodbye to this buttressing effect.
Load-bearing
Using satellite images, aerial observations and model simulations, the researchers worked out how much of each ice shelf is critical for buttressing glaciers, and how much doesn’t provide any additional support. They call this ice “passive”.
Think of it like the structure of a house. There are some walls you can knock through without affecting the ability of the house to hold up the roof. But you wouldn’t want to do the same for a supporting – or “load-bearing” – wall. Remove a supporting wall and you risk the roof falling in.
Let’s take an example. The map below shows the Larsen C ice shelf on the Antarctic Peninsula. The yellow shading shows the metaphorical “supporting walls” – the parts of the ice shelf that are integral to holding back glacier ice. The blue shading and red line show the other “walls” that could be removed without resulting in faster ice flow into the ocean.
Incidentally, the black dashed line indicates a crack currently propagating through the ice shelf, which will likely see the removal of the entire passive area of Larsen-C when it eventually breaks off into the ocean.

Shading indicates the level of buttressing on the Larsen C ice shelf, from areas critical to holding back glacier ice (yellow) to those that don’t provide additional support (blue). The red line indicates the “passive” area that could be could be removed without resulting in faster ice flow into the ocean. The black dotted line shows an existing crack in the ice shelf. The grey shading shows the speed of ice flow from land-based glaciers into the ice shelf (the darker the shading, the faster the flow). Source: Fürst, J. J. et al. (2016).
The map below shows the results of the study for the rest of Antarctica. The mini pie charts around the map indicate the percentage of each ice shelf that is passive (blue) compared to how much is crucial for buttressing (yellow).

Map of buttressing of all Antarctic ice shelves. Shading indicates level of buttressing, from blue (low) to yellow (high) and red lines indicate the “passive” areas. Pie charts illustrate the percentage of each ice shelf that is passive (blue figures). Bold blue figures show average percentage of passive area in that region’s ice shelves. Source: Fürst, J. J. et al. (2016).
On average, across the whole of Antarctica, 13.4% of each ice shelf is passive, but this varies substantially across the continent. For example, as much as 36% of the Shackleton ice shelf in East Antarctica could be lost without major changes to its buttressing effect, the paper notes. On the other hand, many of ice shelves in the Bellingshausen and Amundsen seas in West Antarctica, such as Dotson and Cosgrove, have passive areas that are just a few percent of their total area.
The ice shelves with small passive areas are the ones scientists need to keep the closest eye on, the paper says, because even a small loss of ice is likely to entail an acceleration of the glaciers behind them. As lead author, Dr Johannes Fürst, a researcher at the Friedrich-Alexander-Universität Erlangen-Nürnberg (FAU), explained to Carbon Brief:
Once the ice loss…exceeds the safety band of passive shelf ice, ice flow towards the ocean will accelerate, which might well entail an elevated contribution to sea level rise from Antarctica for decades and centuries to come.
‘Tens to hundreds of thousands of years’
Fürst’s mention of sea level rise for “centuries to come” is particularly pertinent considering a second Nature Climate Change study published today.
The paper aims to tackle the “misleading impression in the public arena” that human-caused climate change is merely a 21st century problem. Our carbon emissions over just a few centuries will remain in the atmosphere for “tens to hundreds of thousands of years,” the paper says. This means our impact on temperatures and sea levels will be around for more than just a few human generations.
Using computer models of the climate, ice sheets and the carbon cycle, the researchers projected changes in temperature and sea levels for the next 10,000 years.
The results are stark. Under four different scenarios of global carbon emissions, the projections suggest a rise in the Earth’s average temperature of between 2C and 7.5C above pre-industrial levels, which would eventually see global sea levels rise by 25-52m.
The lowest emissions scenario is based on total cumulative emissions of 1,280bn tonnes of carbon from the year 2000 to 2300. The closest equivalent from the scenarios used by the Intergovernmental Panel on Climate Change is “RCP4.5”, says lead author Prof Peter Clark, a professor of geology and geophysics at Oregon State University. RCP4.5 is a “stabilisation scenario” where policies are put in place so rising carbon emissions level off around the middle of the century.
Even this medium-low emissions scenario would commit sea levels to rise by 25m in the long-term, Clark says. Approximately 1.3bn people today – 19% of the global population – live in coastal areas less than 25m above sea level, the paper notes.
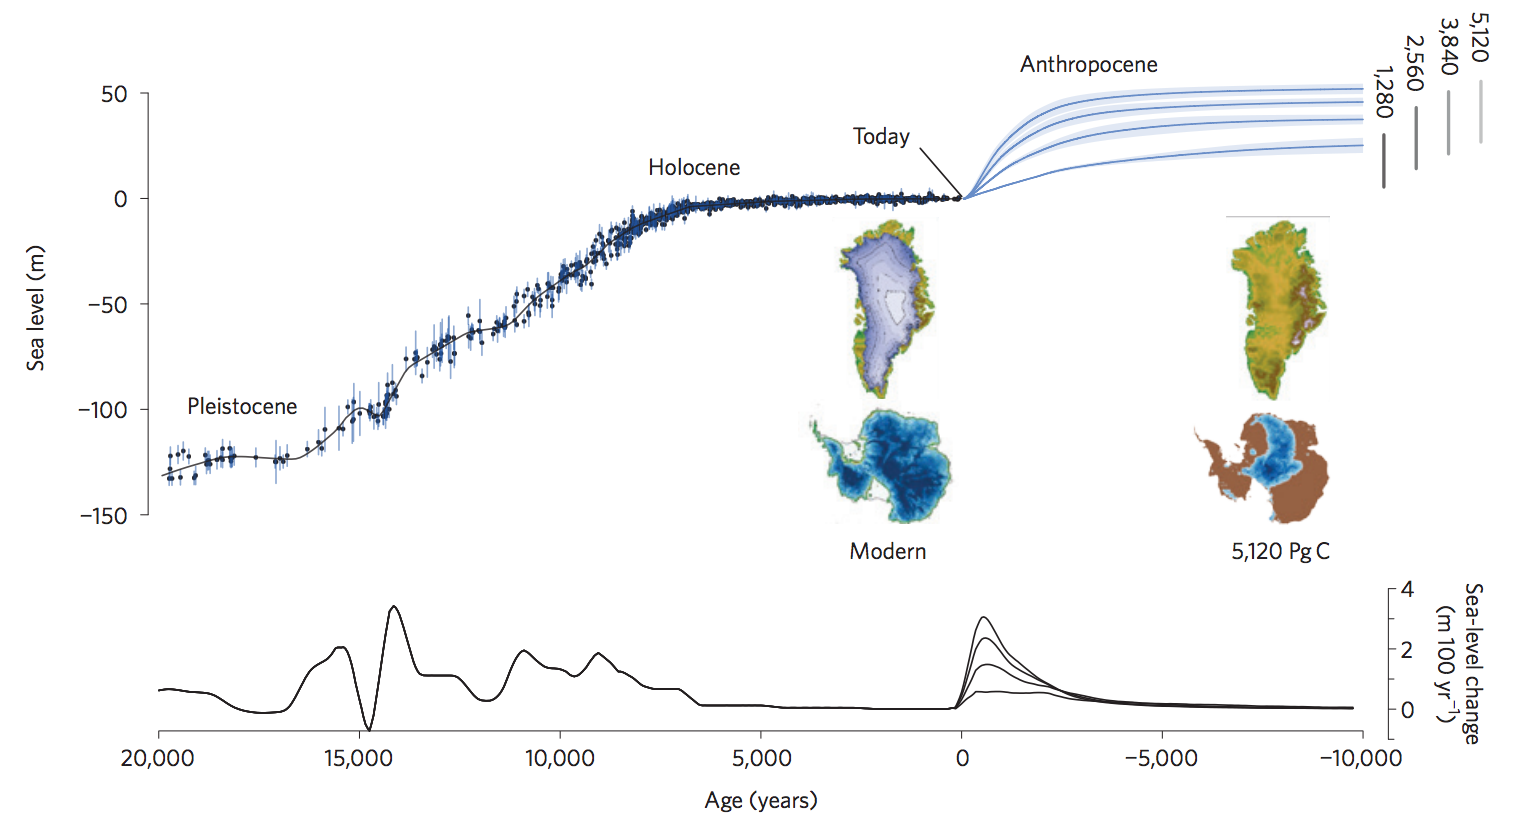
The upper chart below illustrates historical sea levels and the study’s projections for the future. The lower chart shows the same, but in terms of the rate of sea level change. You can see the projected spike in sea level rise over the next millennium in the lower chart, and then, in the upper chart, how those higher sea levels would persist for many millennia to come.
The little inset maps show how much of the Antarctic and Greenland ice sheets would melt under the highest emission scenario and the 7.5C of global temperature rise it could bring.

Past and future global average sea level (upper chart) and sea level change (lower chart), from 20,000 years ago to 10,000 years in the future. Future projections show four different emissions scenarios (figures on right-hand side show total cumulative carbon emissions). Inset maps show current (left) and future projected (right) ice coverage of Greenland and Antarctic ice sheets. Source: Clark et al. (2016).
‘Reshape’ the world
Such high and sustained sea levels would “reshape the geography and ecology of the world,” the paper says, and melting of Antarctica’s ice sheets would be the main culprit – contributing 24-45m to sea levels over the next 10,000 years.
Sea levels would stay high for such a long time because persistent high temperatures would prevent the ice sheets from growing back, says Clark. He tells Carbon Brief:
It’s like heating a pot of water on the stove; it doesn’t boil for quite a while after the heat is turned on – but then it will continue to boil as long as the heat persists. Once carbon is in the atmosphere, it will stay there for tens or hundreds of thousands of years, and the warming, as well as the higher seas, will remain.
The findings highlight that there is only a brief window in the next few decades to avoid “potentially catastrophic climate change that will extend longer than the entire history of human civilization thus far,” the paper says.
And the only solution is complete decarbonisation of the world’s energy systems, Clark says:
Our results show that the carbon we emit now will produce climate-change commitments that last for many millennia, and that the only way to prevent the worst impacts that we identify is to reduce carbon emissions to zero or even negative values as soon as possible. Partial reductions are not going to do the job.
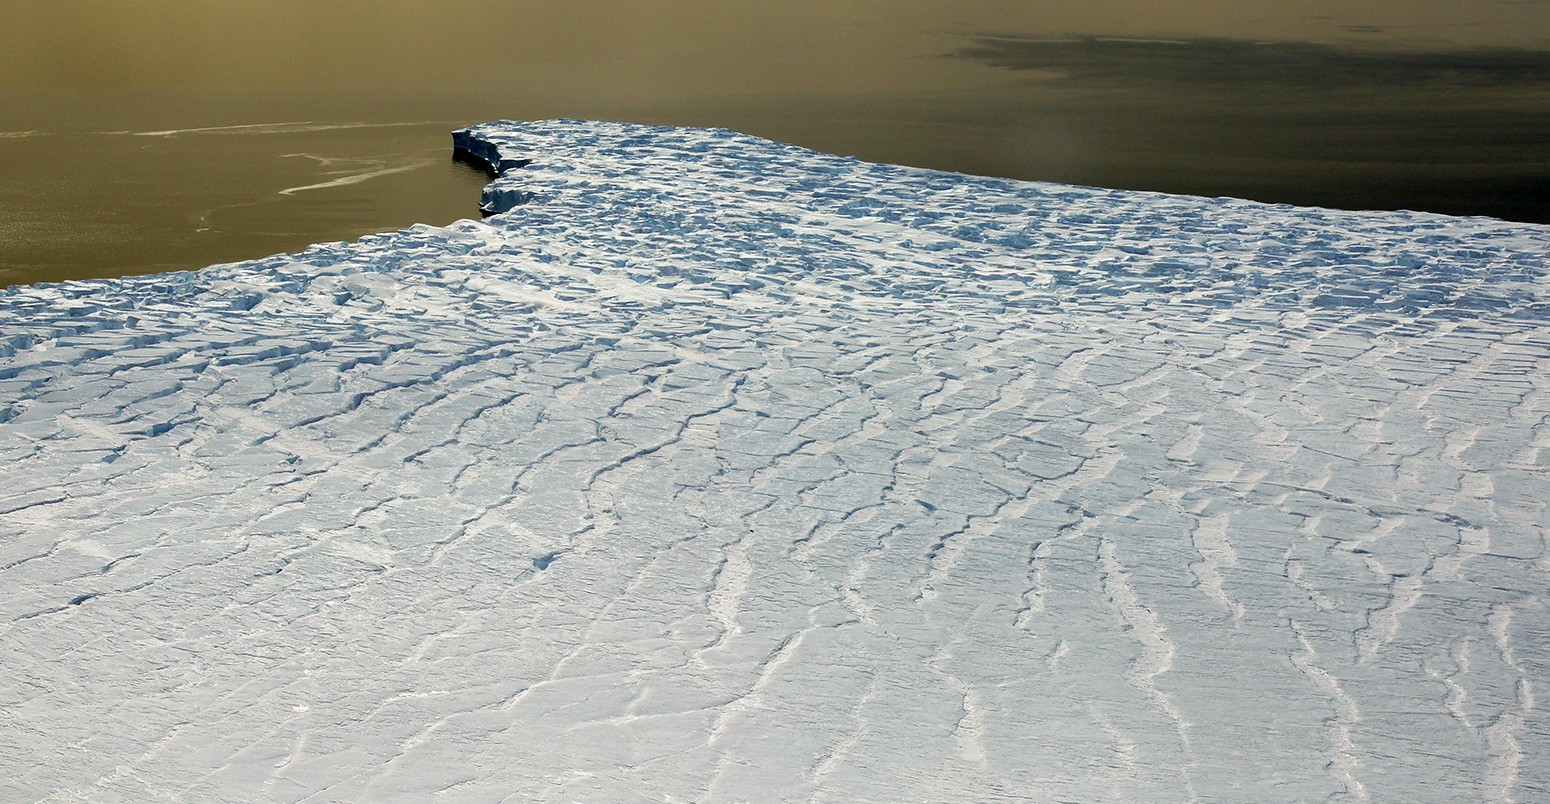
Main image: Highly crevassed ice front of Ferrigno Ice Stream in the Bellingshausen Sea. Picture taken during the airborne NASA IceBridge campaign on November 16, 2011. Picture: Matthias Braun, University of Erlangen-Nuremberg, Germany.
Fürst, J. J. et al. (2016) The safety band of Antarctic ice shelves, Nature Climate Change, doi:10.1038/nclimate2912 & Clark, P. U. et al. (2016) Consequences of twenty-first century policy for multi-millennial climate and sea-level change, Nature Climate Change, doi:10.1038/nclimate2923.
-
Sea level research says only a ‘brief window’ to cut emissions
-
How much ice can Antarctica's ice shelves afford to lose? #SeaLevelRise
-
Greenhouse gas emissions today could lead to tens of metres of sea level rise that persist for hundreds of thousands of years


