Scientists find ‘natural pulses’ in recent melting of West Antarctic ice sheet
Daisy Dunne
08.13.18Daisy Dunne
13.08.2018 | 4:00pmNatural ocean variability is heightening the rate of retreat of the West Antarctic ice sheet, a new study finds.
A 16-year study of ocean conditions in Antarctica suggests that the periodic arrival of warm currents as a result of natural variability is worsening the rate of ice mass loss from key glaciers in the region.
The natural pulses of warm water could be key to driving short-term changes in glacier ice mass loss, the lead author tells Carbon Brief. In the long term, this periodic ocean warming is likely to be exacerbated by climate change, he adds.
The new findings serve as a “smoking gun” by helping scientists to understand the mechanisms behind the ice sheet’s retreat, another scientist tells Carbon Brief.
Breaking ice
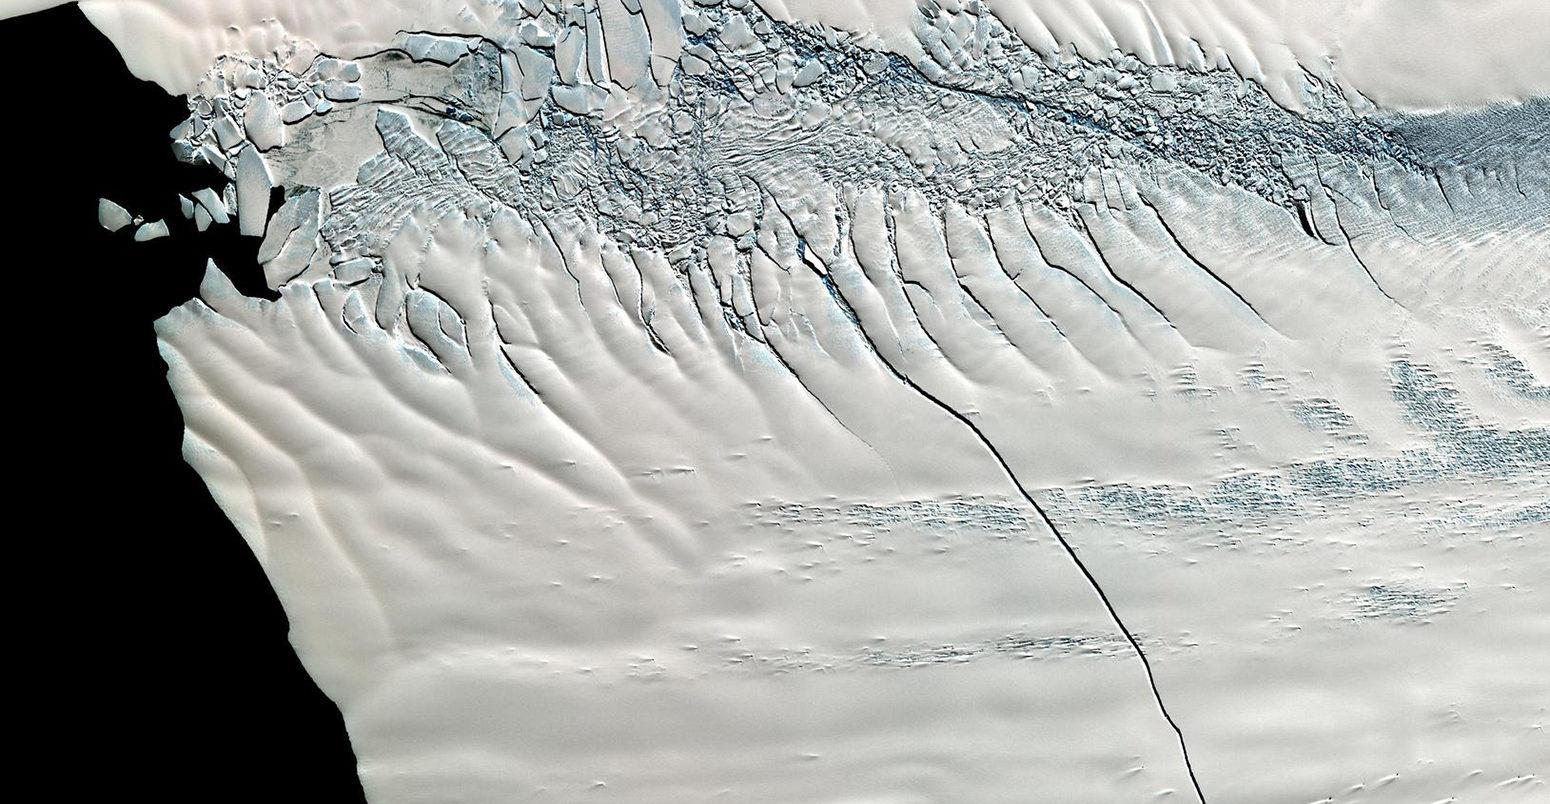
Antarctic ice melt is occuring at an increasingly rapid rate, according to recent satellite data, with mass loss from the West Antarctic ice sheet contributing the most to this rise.
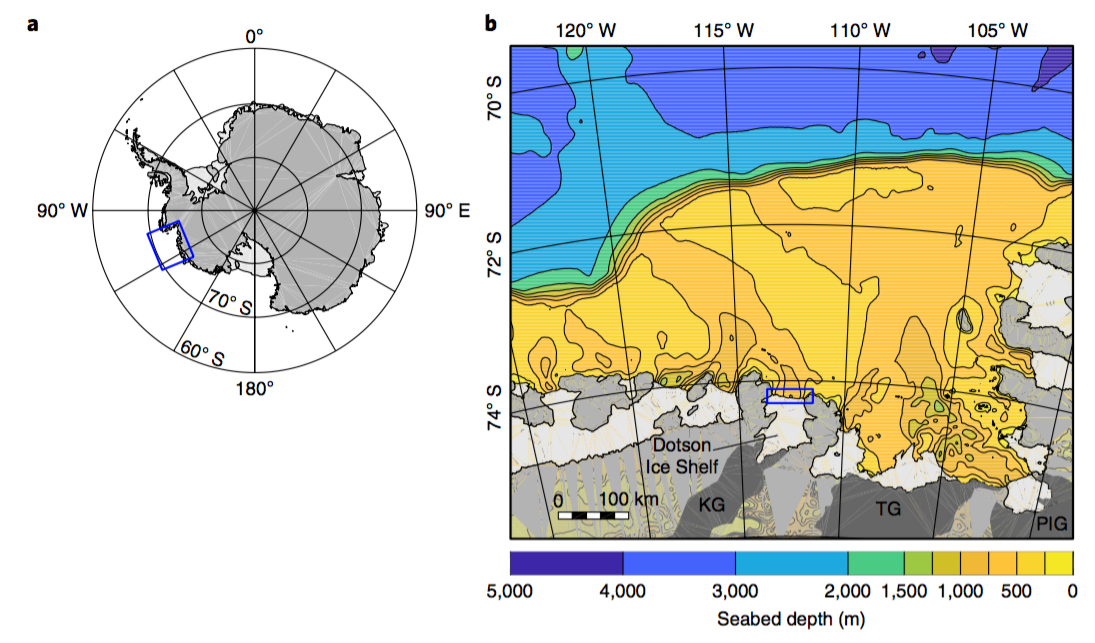
The Amundsen Sea Embayment (ASE) in West Antarctica (marked with a blue square on the map of Antarctica below) is an area of ice roughly the size of Texas that drains into the Amundsen Sea. It contains both the Pine Island and Thwaites glaciers.

Map A shows the location of grounded ice sheets (dark grey), floating ice sheets (light grey) and the study area (blue box). Map B shows an enlargement of the study area, yellow indicates where the seabed is shallow whereas dark blue indicates where the seabed is deep. The location of the Kohler (KG), Thwaites (TG) and Pine Island (PIG) glaciers are highlighted. Source: Jenkins et al. (2018)
The ASE alone is currently responsible for a quarter of all of the world’s ice melt.
The region is thought to be particularly vulnerable to melting because it is primarily made up of “marine-based” glaciers, which sit on land below sea level. Where the face of a glacier meets the ocean, warm water can melt it from underneath, gradually forcing back the “grounding line” – where the underside of the glacier rests on the seabed.
The new study, published in Nature Geoscience, documents how natural ocean variability could be affecting the rate of retreat across the ice sheet.
The research finds that, in the short term, the West Antarctic ice sheet is “more sensitive” to natural variability than previously realised, says Dr Adrian Jenkins, a senior research scientist at the British Antarctic Survey. He tells Carbon Brief:
“This changes how we understand the impact of climate change on the West Antarctic ice sheet. The length and severity of the warm phases in the ocean matters far more for the ice sheet than the average climate.”
Collecting currents
For the study, the researchers visited the Dotson ice shelf (pictured on the chart above) over eight summers from 2000-16.
Each time, they collected a range of data on the ocean conditions, including on the temperature, saltiness and amount of oxygen present in the water.
Combining this information together, the researchers devised a “normalised temperature index” as an indicator of “warm” and “cool” ocean phases.
To infer ocean conditions in the study region further back in time, the researchers had to look further afield. For this they used historical sea surface temperature data for the tropical Pacific Ocean.
While the tropical Pacific is thousands of miles from the Antarctic, its sea surface temperatures are an important barometer for the climate phenomenon El Niño. And it is this natural climatic event that is thought to be behind the changes to ocean currents close to the West Antarctic ice sheet, Jenkins explains:
“The currents are affected by shifting wind patterns and those respond to the El Niño cycle in the tropical Pacific Ocean. So, from the much longer and more detailed records of conditions in the tropical Pacific Ocean, we can infer what conditions might have been like in the Amundsen Sea.”
In the Amundsen Sea, warm water is carried towards the ice via the Circumpolar Deep Water current. Circumpolar Deep Water (CDW) is relatively warm and salty seawater found at depths of around 500-1,000 metres.
The researchers believe that El Niño is altering the strength of these ocean currents, periodically pulling or pushing the CDW towards or away from the glaciers on Antarctica’s coast, driving the “warm” and “cool” ocean phases, respectively.

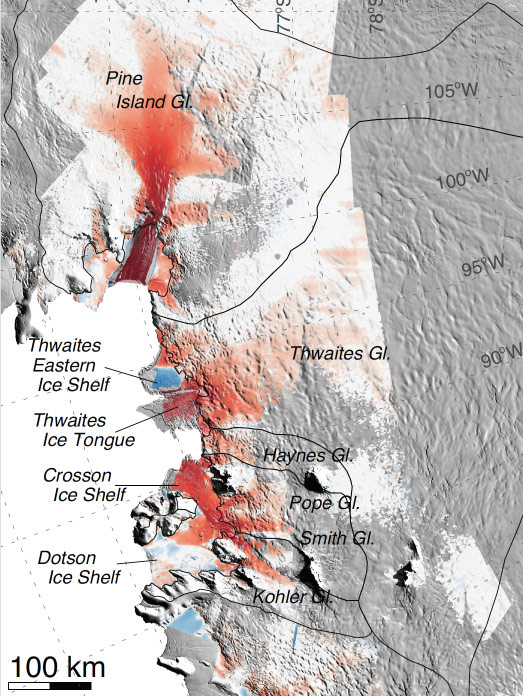
Map of the Amundsen Sea Embayment showing the location of the Crosson and Dotson ice shelves, and the Thwaites, Pine Island and Haynes glaciers. Source: NASA/Eric Rignot
For the next part of the study, the researchers compared the temperature index data to satellite data showing changes to ice mass from key glaciers in the region from 1978-2015.
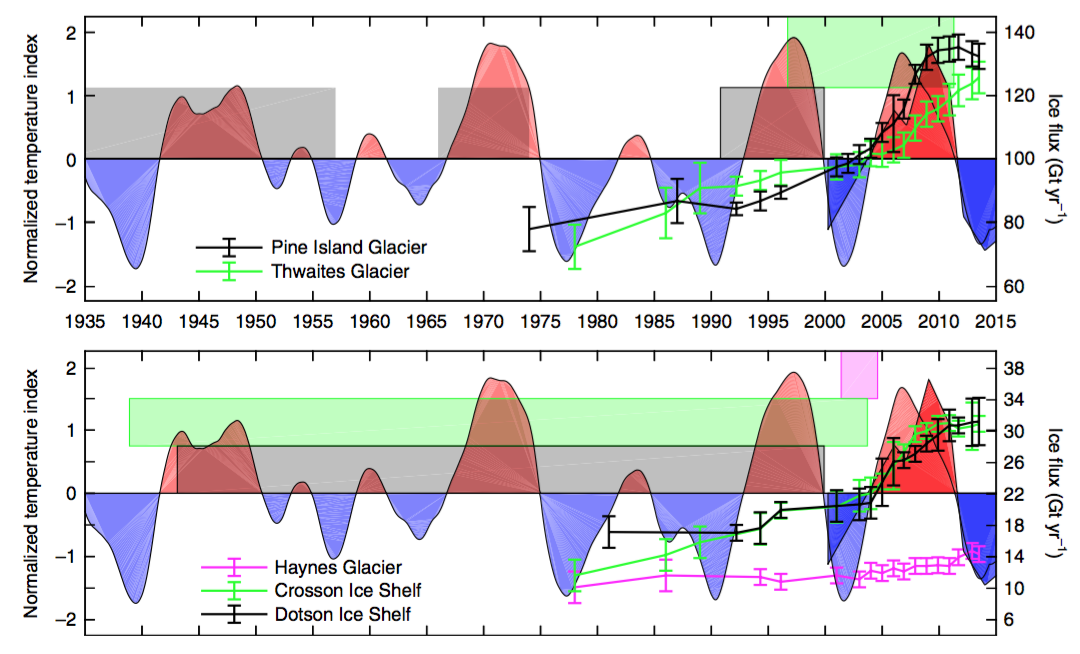
The charts below show the changes to sea temperature in the region, with “warm phases” shown in red and “cool phases” shown in blue, from 1935-2015. Dark shading shows the observed results, while light shading shows the results inferred from the historical data.
On the top chart, ice mass changes from the Pine Island (black) and Thwaites (green) glaciers are included. Below, ice mass changes from the Haynes glacier (pink), and the Crosson (green) and Dotson ice shelves (black) are shown. On both maps, colour-coded boxes show the range of estimated dates when the retreat of the glaciers first began.

Ocean conditions (“warm phases” shown in red, “cool phases” shown in blue) compared to ice mass changes from, top, the Pine Island (black) and Thwaites (green) glaciers, and, bottom, the Haynes glacier (pink), and Crosson (green) and Dotson (black) ice shelves. Colour-coded boxes show the range of estimated dates when the retreat of the glaciers first began. Source: Jenkins et al. (2018)
The results show how the rate of ice mass loss from several key glaciers seems to accelerate when the ocean is undergoing a “warm phase”. The researchers calculate that, over the study period, the average rate of ice melt was four times higher during the “warm” phases, when compared to the “cool” phases.
‘Smoking gun’
The results show how, while climate change is causing glacier retreat to increase in the long term, short-term changes in ice loss are likely to be driven by natural variability, Jenkins says:
“We should think about the problem in a way that is analogous to the way we think about how sea-level rise will affect our coasts. The critical issue is not so much the longer-term rise in the average sea level, but more the level and frequency of the extreme events caused by storm surges.”
The findings will enable scientists to make “clear connections” between changes to sea temperatures and the rate of glacier retreat observed by satellites, says Dr Erik Ivins, a senior research scientist at the NASA Jet Propulsion Laboratory and co-leader of the Ice Sheet Mass Balance Inter-comparison Exercise (IMBIE).
(IMBIE is a project aimed at assessing how melting in world’s polar regions could be contributing to sea level rise). Ivins was not involved in the new research. He tells Carbon Brief:
“It presents the type of measurements we need to make clear connections during the era of space observations of velocity and ice flux increases to a definite driving mechanism, for which we speculate that it is ocean warm water, since we have ancillary evidence of that – but no smoking gun. This is very much the smoking gun.”
Agreeing with Ivins, Prof Helen Fricker, a glaciologist from the Scripps Institution of Oceanography at the University of California, San Diego, who was also not involved in the research, tells Carbon Brief:
“There are so very few ocean measurements in this part of Antarctica and almost none of this length. The satellite record is now long enough that signatures are starting to emerge of the atmospheric and oceanic processes that are causing the ice sheet to change. But the satellite data needs validating and measurements like the ones reported here are vital.”
However, more research is needed to understand the importance of ocean variability for future glacier retreat in relation to climate change, says Prof Andrew Shepherd, co-leader of IMBIE and director of the Natural Environment Research Council (NERC) Centre for Polar Observation and Modelling based at the University of Leeds. He tells Carbon Brief:
“Even if the heat delivered to Antarctica by the Amundsen Sea has pulsated over decades, the regions glaciers are slow to react and so, overall, their contribution to global sea level has risen steadily.
“Today’s ocean melting is driving the ice sheet to retreat 10 times faster than at any time in the geological record, and so it’s important to learn whether the warm ocean currents will continue to pulse and drive accelerating sea-level rise in future decades.”
Jenkins, A. et al. (2018) West Antarctic Ice Sheet retreat in the Amundsen Sea driven by decadal oceanic variability, Nature Geoscience, https://www.nature.com/articles/s41561-018-0207-4
-
Scientists find ‘natural pulses’ in recent melting of West Antarctic ice sheet
-
West Antarctic ice sheet ‘more sensitive’ to natural variability than thought

