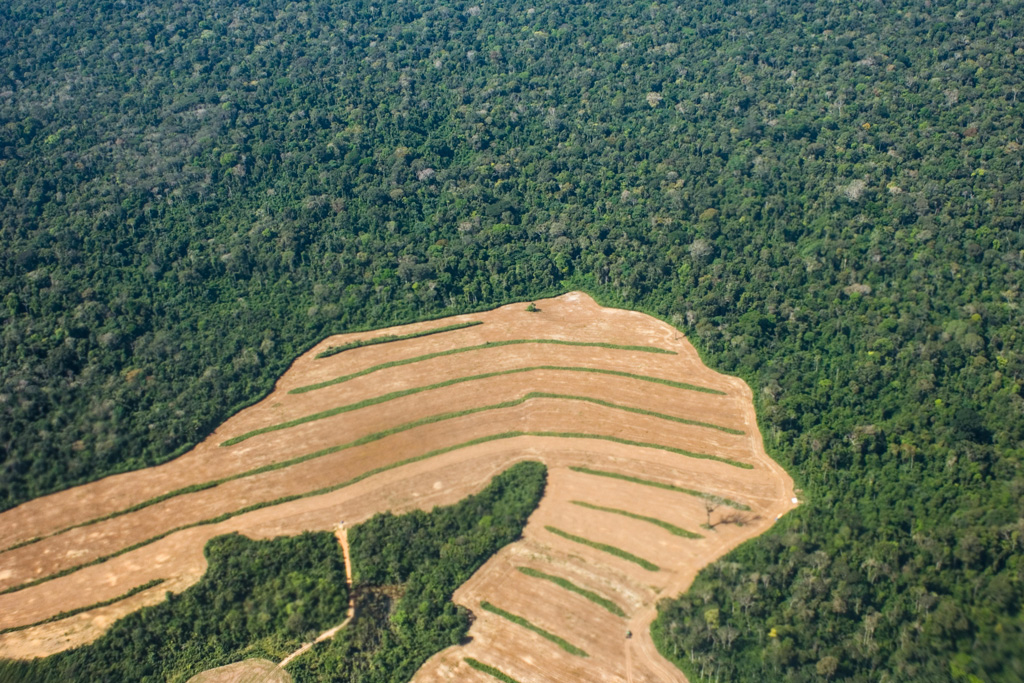
Scientists calculate trade-related ‘deforestation footprint’ of rich countries
Ayesha Tandon
03.29.21Ayesha Tandon
29.03.2021 | 4:00pmMany developed countries are “encouraging” deforestation in poorer nations through international trade, new research shows.
Agriculture is responsible for 90% of deforestation globally (pdf). This is mainly driven by demand for goods – including coffee, chocolate, cattle, soy, palm oil and timber – that are often then traded and consumed in countries around the world.
The new study – published in Nature Ecology and Evolution – calculates the “deforestation footprints” of individual countries, comparing their domestic deforestation to that which they “import” from abroad through their consumption of foreign-made products.
The UK, Germany, France, Italy and Japan “imported” more than 90% of their national deforestation footprints from abroad between 2001 and 2015, the study finds, of which between 46% and 57% was from tropical forests.
“We wish people would think more about deforestation before buying and consuming forest-risk commodities,” the lead author of the study tells Carbon Brief. He warns that “obtaining net forest gains domestically, but expanding non-domestic deforestation footprints – especially in the tropics – might do more harm than good for climate change mitigation”.
‘Imported deforestation’
Forests cover 31% of the global land surface and provide important services, such as sequestering carbon and protecting biodiversity. However, deforestation is now one of the largest sources of greenhouse-gas emissions on the planet. A report from the UN Food and Agricultural Organisation estimates that only around half of the world’s forests are still “relatively intact”.
Previous research suggests that 29-39% of deforestation-related emissions are driven by international trade. However, while forest clearance often takes place in developing nations, the demand for commodities generally comes from richer countries.
Dr Daniel Moran – a researcher from the Norwegian University of Science and Technology who was not involved in the study – explains that developed countries are driving deforestation overseas through consumer choices:
“It’s easy to look at the farmers, foresters and countries where deforestation is occurring and wish they would stop. But they are responding to signals from the global market. We are buying their soy as feed for our hamburgers and salmon and their palm oil as input to our lipstick.”
The new study estimates how much deforestation countries “import” through the logging associated with the goods they receive in trade. The authors then calculate a country’s “deforestation footprint” from its “imported deforestation” plus any domestic deforestation.
The maps below show the cumulative deforestation footprints of China, Brazil, Germany, Singapore, Japan and the US for 2001-15. The shading shows where each country’s deforestation footprint originates and the scale of forest loss it drives.
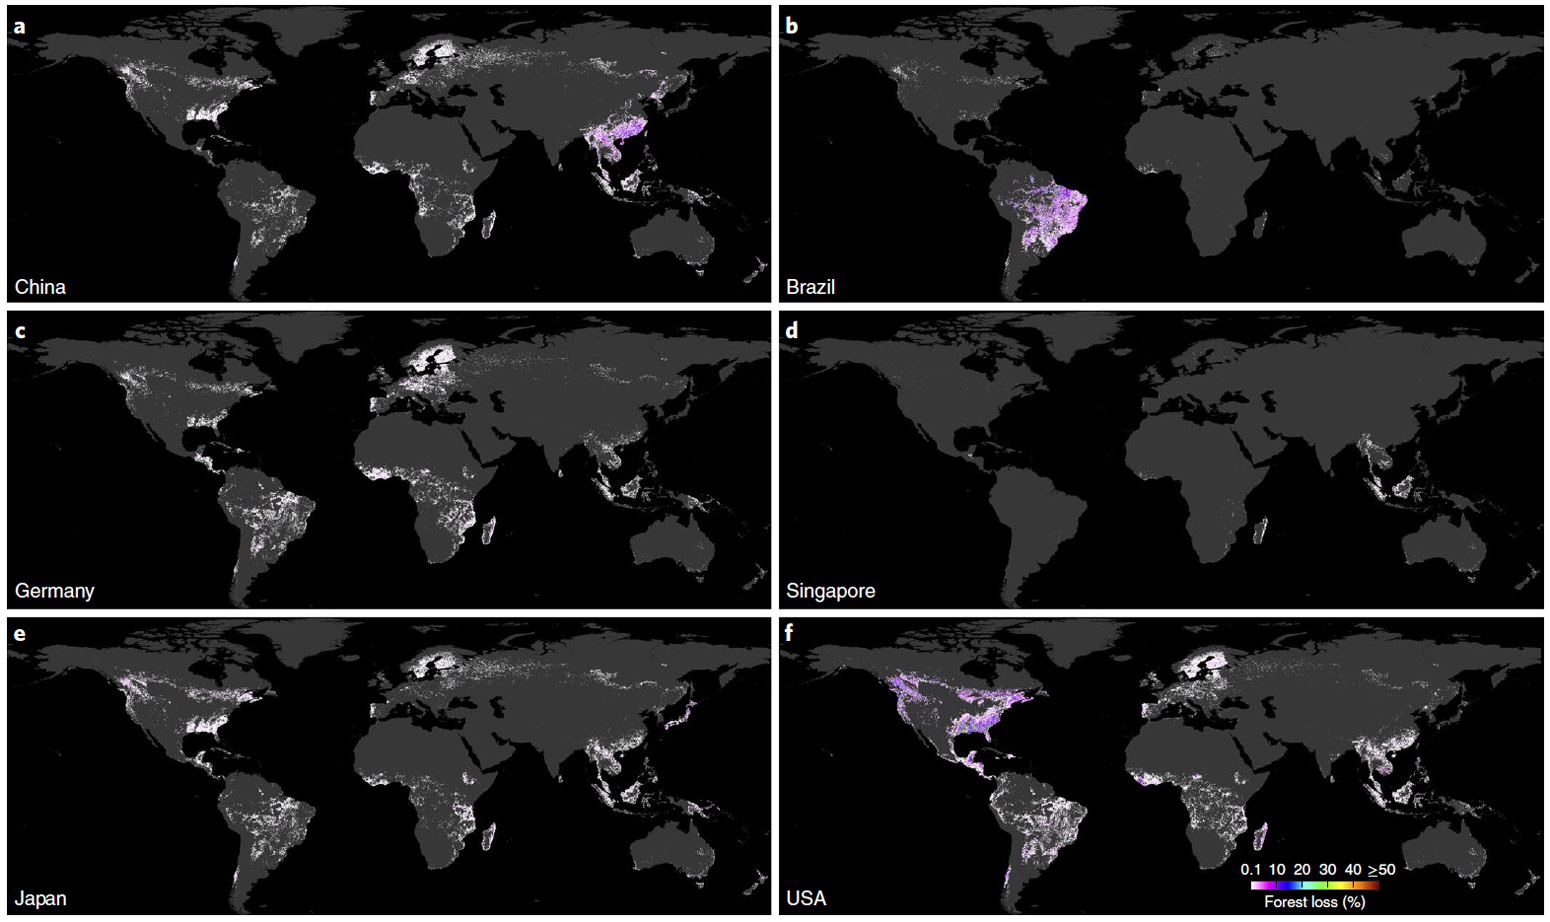
This map is developed using forest loss data, analysis of the drivers of deforestation and a global supply chain model. For this study, “deforestation” is defined as a grid square in which all vegetation above five metres in height has been cleared.
The study is global, and calculates deforestation footprints for a range of countries. However, the authors also focus on these six countries because Japan, the US, Germany and China are currently the world’s four largest economies. Meanwhile, Brazil is home to the world’s largest area of tropical rainforest and Singapore is classified as one of the four “Asian Tigers” due to its rapid economic growth.
Most timber products from the Atlantic forest in Brazil are used locally, the study finds, but demand for soy and beef in the US, China and countries throughout the European Union also drive Brazilian deforestation.
More than half of Earth’s remaining tropical rainforests are located in the Amazon Basin, where deforestation has “increased sharply” under the presidency of Jair Bolsonaro, the study notes.
The map also shows a strong US influence in Canada which, according to the study, is because the US is the primary export destination for Canada’s forest products. The US has the most clearly distinguishable footprint, the study adds, importing timber from Cambodia, rubber and related products from Liberia, edible fruits and nuts from Guatemala and soy and beef from Brazil.
China, South Korea and Japan also engage in “timber exploitation” in north Vietnam, the paper adds, while Germany poses the highest risk to forests in Côte d’Ivoire and Ghana through its demand for cocoa.
The deforestation leaderboard
The plot below shows how national deforestation footprints have changed between 2001 and 2015 for the six focus countries.
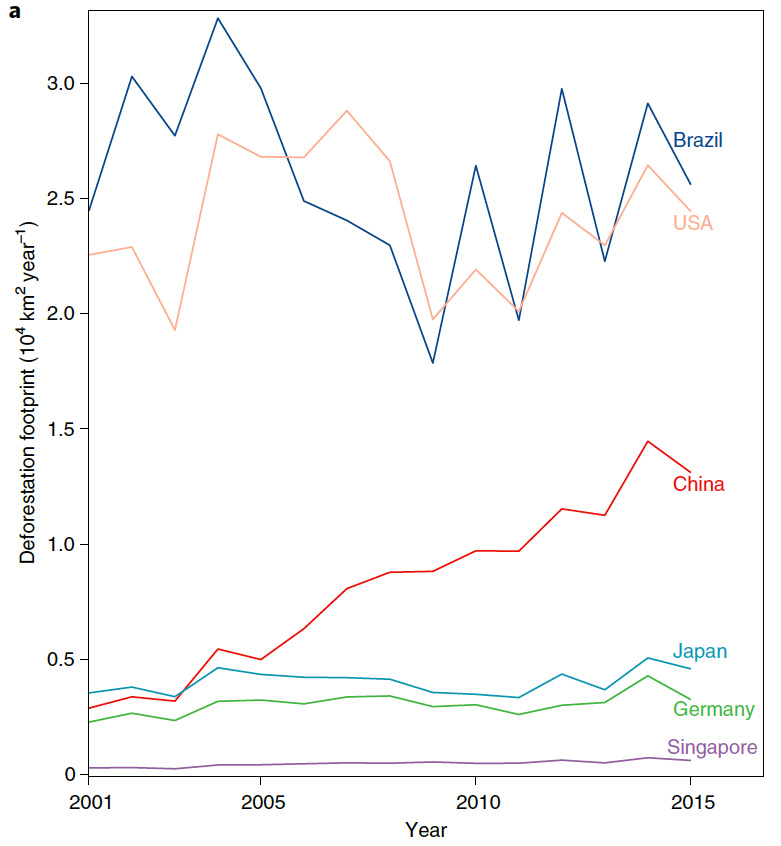
The chart shows the scale of the deforestation footprints of the US (pink line) and Brazil (blue), while also highlighting how China’s (red) has increased steadily since 2001.
The study notes that China – along with India and many developed countries – have increased their imported deforestation while also seeing forest gains within their borders. In 2014, for example, China and India’s imported deforestation was more than six times their 2001 levels.
Moran tells Carbon Brief that these findings for India and China are “fascinating”:
“This is a potentially delicate situation – the countries have realised net afforestation at home, but their global deforestation footprint has actually grown due to outsourcing… the fact that the environmental damage is being done elsewhere makes it more difficult – both morally and logistically – to motivate political change at home.”
The authors also look at each country’s per-capita (per person) deforestation levels. The plots below show the number of trees lost (left) and the area of forest removed in metres squared (right) for 24 countries in 2015. The blue bars show domestic deforestation and red show imported (“non-domestic”) deforestation.
It is worth noting that these figures only show the absolute forest losses without compensating for forest restoration.
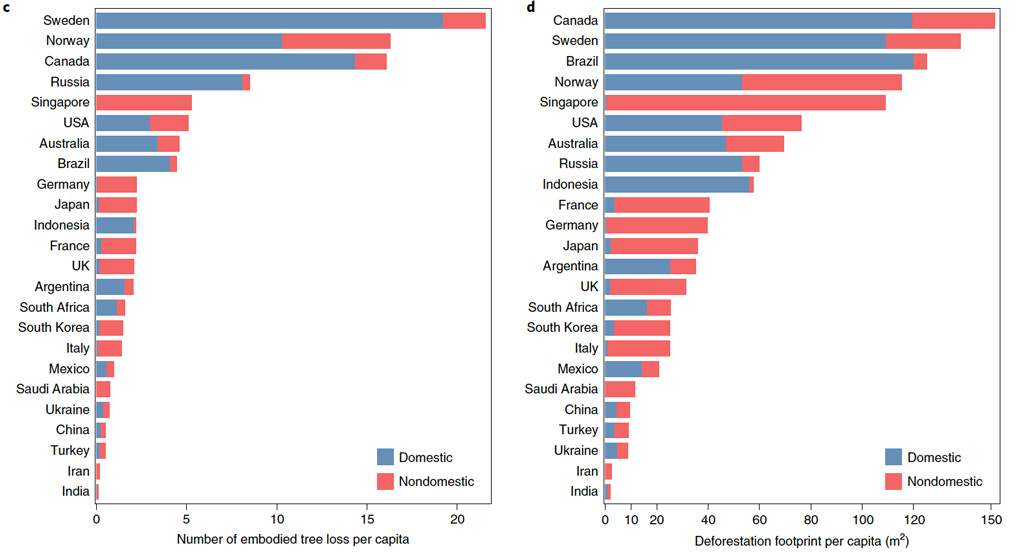
Residents in G7 countries drove an average loss of 3.9 trees or 58m2 of forest per capita through their consumption patterns in 2015, the results show, with the per-capita tree loss of the US in 2015 clocking in at twice that of Japan, Germany, France or the UK.
Tree loss in Singapore was almost entirely imported from south-east Asia, the study notes. Meanwhile, Brazilian deforestation was predominantly categorised as domestic – although much of it was the result of producing goods that would be exported.
Tropical deforestation
To explore the impacts of deforestation from different types of forests, the authors define six forest “domains” using data from the US environmental organisation the Nature Conservancy – tropical, temperate, boreal, mangroves, mediterranean and “other”.
While global deforestation is decreasing overall, the study finds that imports of tropical deforestation-related commodities are on the rise. Most developed countries and China have become “major” importers of tropical deforestation-related commodities, while developing countries such as Brazil are “major” exporters.
Tropical forests are the most threatened by supply chains in many countries, the study says. For example, for 2015, the research shows that Japan, Germany, France, the UK and Italy imported 91-99% of their deforestation from abroad, of which 46–57% was from tropical forests.
Prof Simon Lewis – a researcher from the University of Leeds and University College London – wrote a Carbon Brief guest post on tropical forests last year. In it, he explains that tropical forests are important carbon stores:
“Of particular importance are intact tropical forests, which, according to a landmark paper published in 2011, absorbed 15% of all human-generated CO2 emissions between 1990 and 2007.”
Lewis tells Carbon Brief that there are also human rights issues linked to tropical deforestation:
“Tropical deforestation is often linked to human rights abuses because much tropical deforestation is illegal, alongside better-known global impacts on climate change and biodiversity loss.”
Dr Nguyen Tien Hoang from the Research Institute for Humanity and Nature is the lead author of the study. Hoang adds that tropical forests also “stand out as the richest biodiverse ecosystems – harbouring 50-90% of all terrestrial species”.
The plot below shows the deforestation imports and exports from selected countries in 2001 and 2015. Bars to the left of the y-axis indicate that the country is a net exporter of deforestation from the specified biome, while bars to the right indicate that it is a net importer.
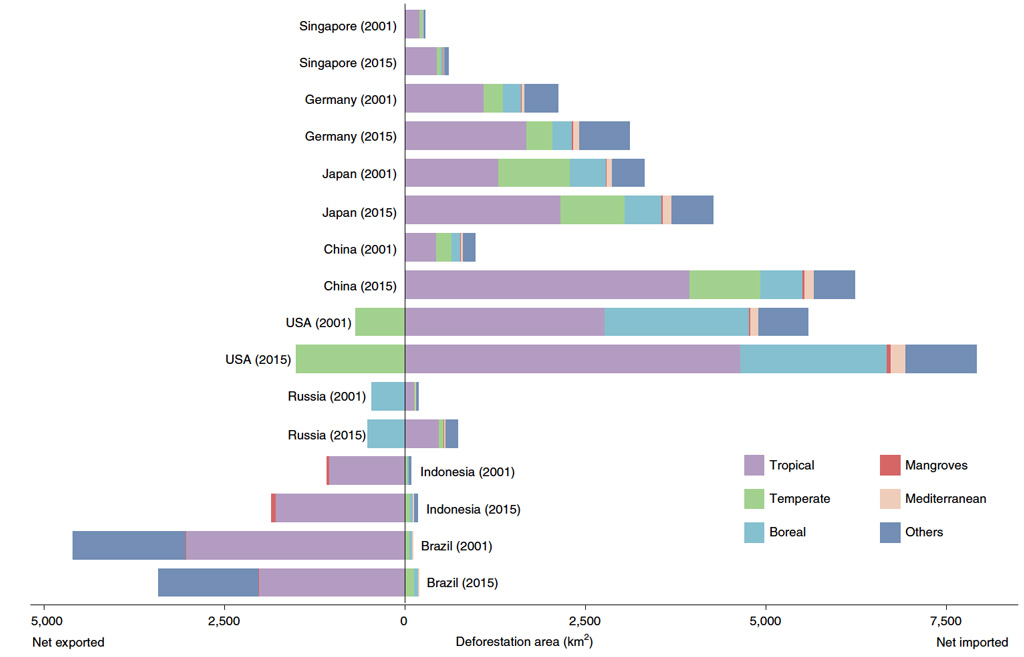
The plot shows that deforestation for the countries listed is more significant for tropical forests than for any other biome. Furthermore, while exports of tropical deforestation decreased in Brazil between 2001 and 2015, imports increased in this time in the US, China, Japan, Germany and Singapore.
Ending deforestation ‘essential’ for net-zero
“This study shows us a way forward”, Moran tells Carbon Brief:
“It shines a light on these complex global supply chains and shows us which purchases induce deforestation. The way their methods expose the complete supply chains means that consumers, companies and governments at the producer, trade and consumer points of the supply chain can all recognise their role and be given a voice.”
Hoang tells Carbon Brief that the responsibility of reducing deforestation “may have to be shared between the public and private sectors and between producers and consumers” and notes that developed nations need to help developing countries to protect their forests:
“Developed countries have strong financial and legal foundations to reduce their deforestation footprints. Conversely, forest protection at the tropics, mainly including poor and developing countries, requires long-term and comprehensive solutions, along with significant funding. There is a need for resource sharing from developed countries to protect forests in tropical countries.”
“Ending deforestation is an essential part of achieving net-zero emissions and stabilising our climate,” Lewis tells Carbon Brief. He adds the tackling the deforestation caused by agriculture will be key:
“The key implication of the findings is the need for deforestation-free supplies of agricultural products to feed 7.8 billion people globally. This will require interlocking and reinforcing policies, from clear land tenure in tropical forest regions to tracing product supply chains, alongside tackling food waste and some people changing diets away from high meat consumption because this meat production is a very inefficient use of land.”
Meanwhile, Dr Niki De Sy – an associate professor at Wageningen University and Research who was not involved in the study – tells Carbon Brief that as well as the national trends shown in this paper, more specific monitoring will be needed to help make policy decisions regarding deforestation.
She adds that the paper “very nicely shows” the importance of looking at deforestation in terms of global supply chains, and notes that international climate change and deforestation policy is currently focused on national commitments:
“This paper shows that as an underlying driver, international trade should not be ignored, and that consumer countries should play a role to – or be held accountable – for part of that deforestation as well.
“For me this illustrates that as long as the ‘business as usual’ around commodities linked with deforestation does not change, it will find a way of least resistance.”
Hoang, N. T. and Kanemoto, K. (2021) Mapping the deforestation footprint of nations reveals growing threat to tropical forests, Nature Ecology & Evolution, doi:10.1038/s41559-021-01417-z.
-
Scientists calculate trade-related ‘deforestation footprint’ of rich countries
-
Developed countries ‘import deforestation’ from poorer nations, new study finds

