
Revealed: How colonial rule radically shifts historical responsibility for climate change
Multiple Authors
11.26.23Multiple Authors
26.11.2023 | 7:00pmHistorical responsibility for climate change is radically shifted when colonial rule is taken into account, Carbon Brief analysis reveals.
The first-of-its-kind analysis offers a thought-provoking fresh perspective on questions of climate justice and historical responsibility, which lie at the heart of the global climate debate.
In total, humans have collectively pumped 2,558bn tonnes of CO2 (GtCO2) into the atmosphere since 1850, enough to warm the planet by 1.15C above pre-industrial temperatures.
This means that, by the end of 2023, more than 92% of the carbon budget for 1.5C will have been used up – leaving less than five years remaining if current annual emissions continue.
However, responsibility for using up this global budget is highly unequal. The wealthiest countries – and within each nation the wealthiest individuals – have taken a disproportionate share.
Previous Carbon Brief analysis already showed the US (20%) to be the world’s largest contributor to warming. Yet it implicitly allocated none of the responsibility for emissions under colonial rule to the colonial rulers, even though they held ultimate decision-making authority at the time.
The new analysis tests the implications of reversing this assumption. It finds the US (21%) and China (12%) still top – but the share of former colonial powers growing significantly.
The French share of historical emissions rises by half, the UK nearly doubles, the Netherlands nearly triples and Portugal more than triples. Together, the EU+UK’s responsibility for warming rises by nearly a third, to 19%.
India is among the former colonies seeing its share of historical responsibility fall (by 15%, to below the UK), with Indonesia down by 24% and Africa’s already small contribution also dropping 24%.
Notably, former colonial powers such as the UK and the Netherlands are much more prominent in the history of cumulative global CO2 emissions shown in the animation above.
While former colonies such as India and Indonesia are less prominent as a result, they still have significant emissions in the post-colonial era, pushing them into the top 10 as of 2023.
As before, the new analysis is based on CO2 emissions from the burning of fossil fuels and cement production, along with land use, land use change and forestry (LULUCF).
It covers the period from 1850 – often taken as the baseline for current warming – through to 2023, drawing primarily on a recent compilation of emissions estimates.
The assignment of colonial responsibility for emissions is largely based on research into the emergence of independent nation states since the early 19th century.
Other key findings of the analysis include:
- As a group, the EU+UK collectively ranks second for emissions within its own borders (375GtCO2, 14.7% of the global total). This climbs by nearly a third after adding colonial emissions, to 478GtCO2 and 18.7% of the global total – just behind the US.
- The UK ranks fourth in the world when accounting for colonial emissions – jumping ahead of its former colony India. Including emissions under British rule in 46 former colonies, the UK is responsible for nearly twice as much global warming as previously thought (130GtCO2 and 5.1% of the total, instead of 76GtCO2 and 3.0%).
- The largest contributions to the UK’s colonial emissions are from India (13GtCO2, cutting its own total by 15%), Myanmar (7GtCO2, -49%) and Nigeria (5GtCO2, -33%).
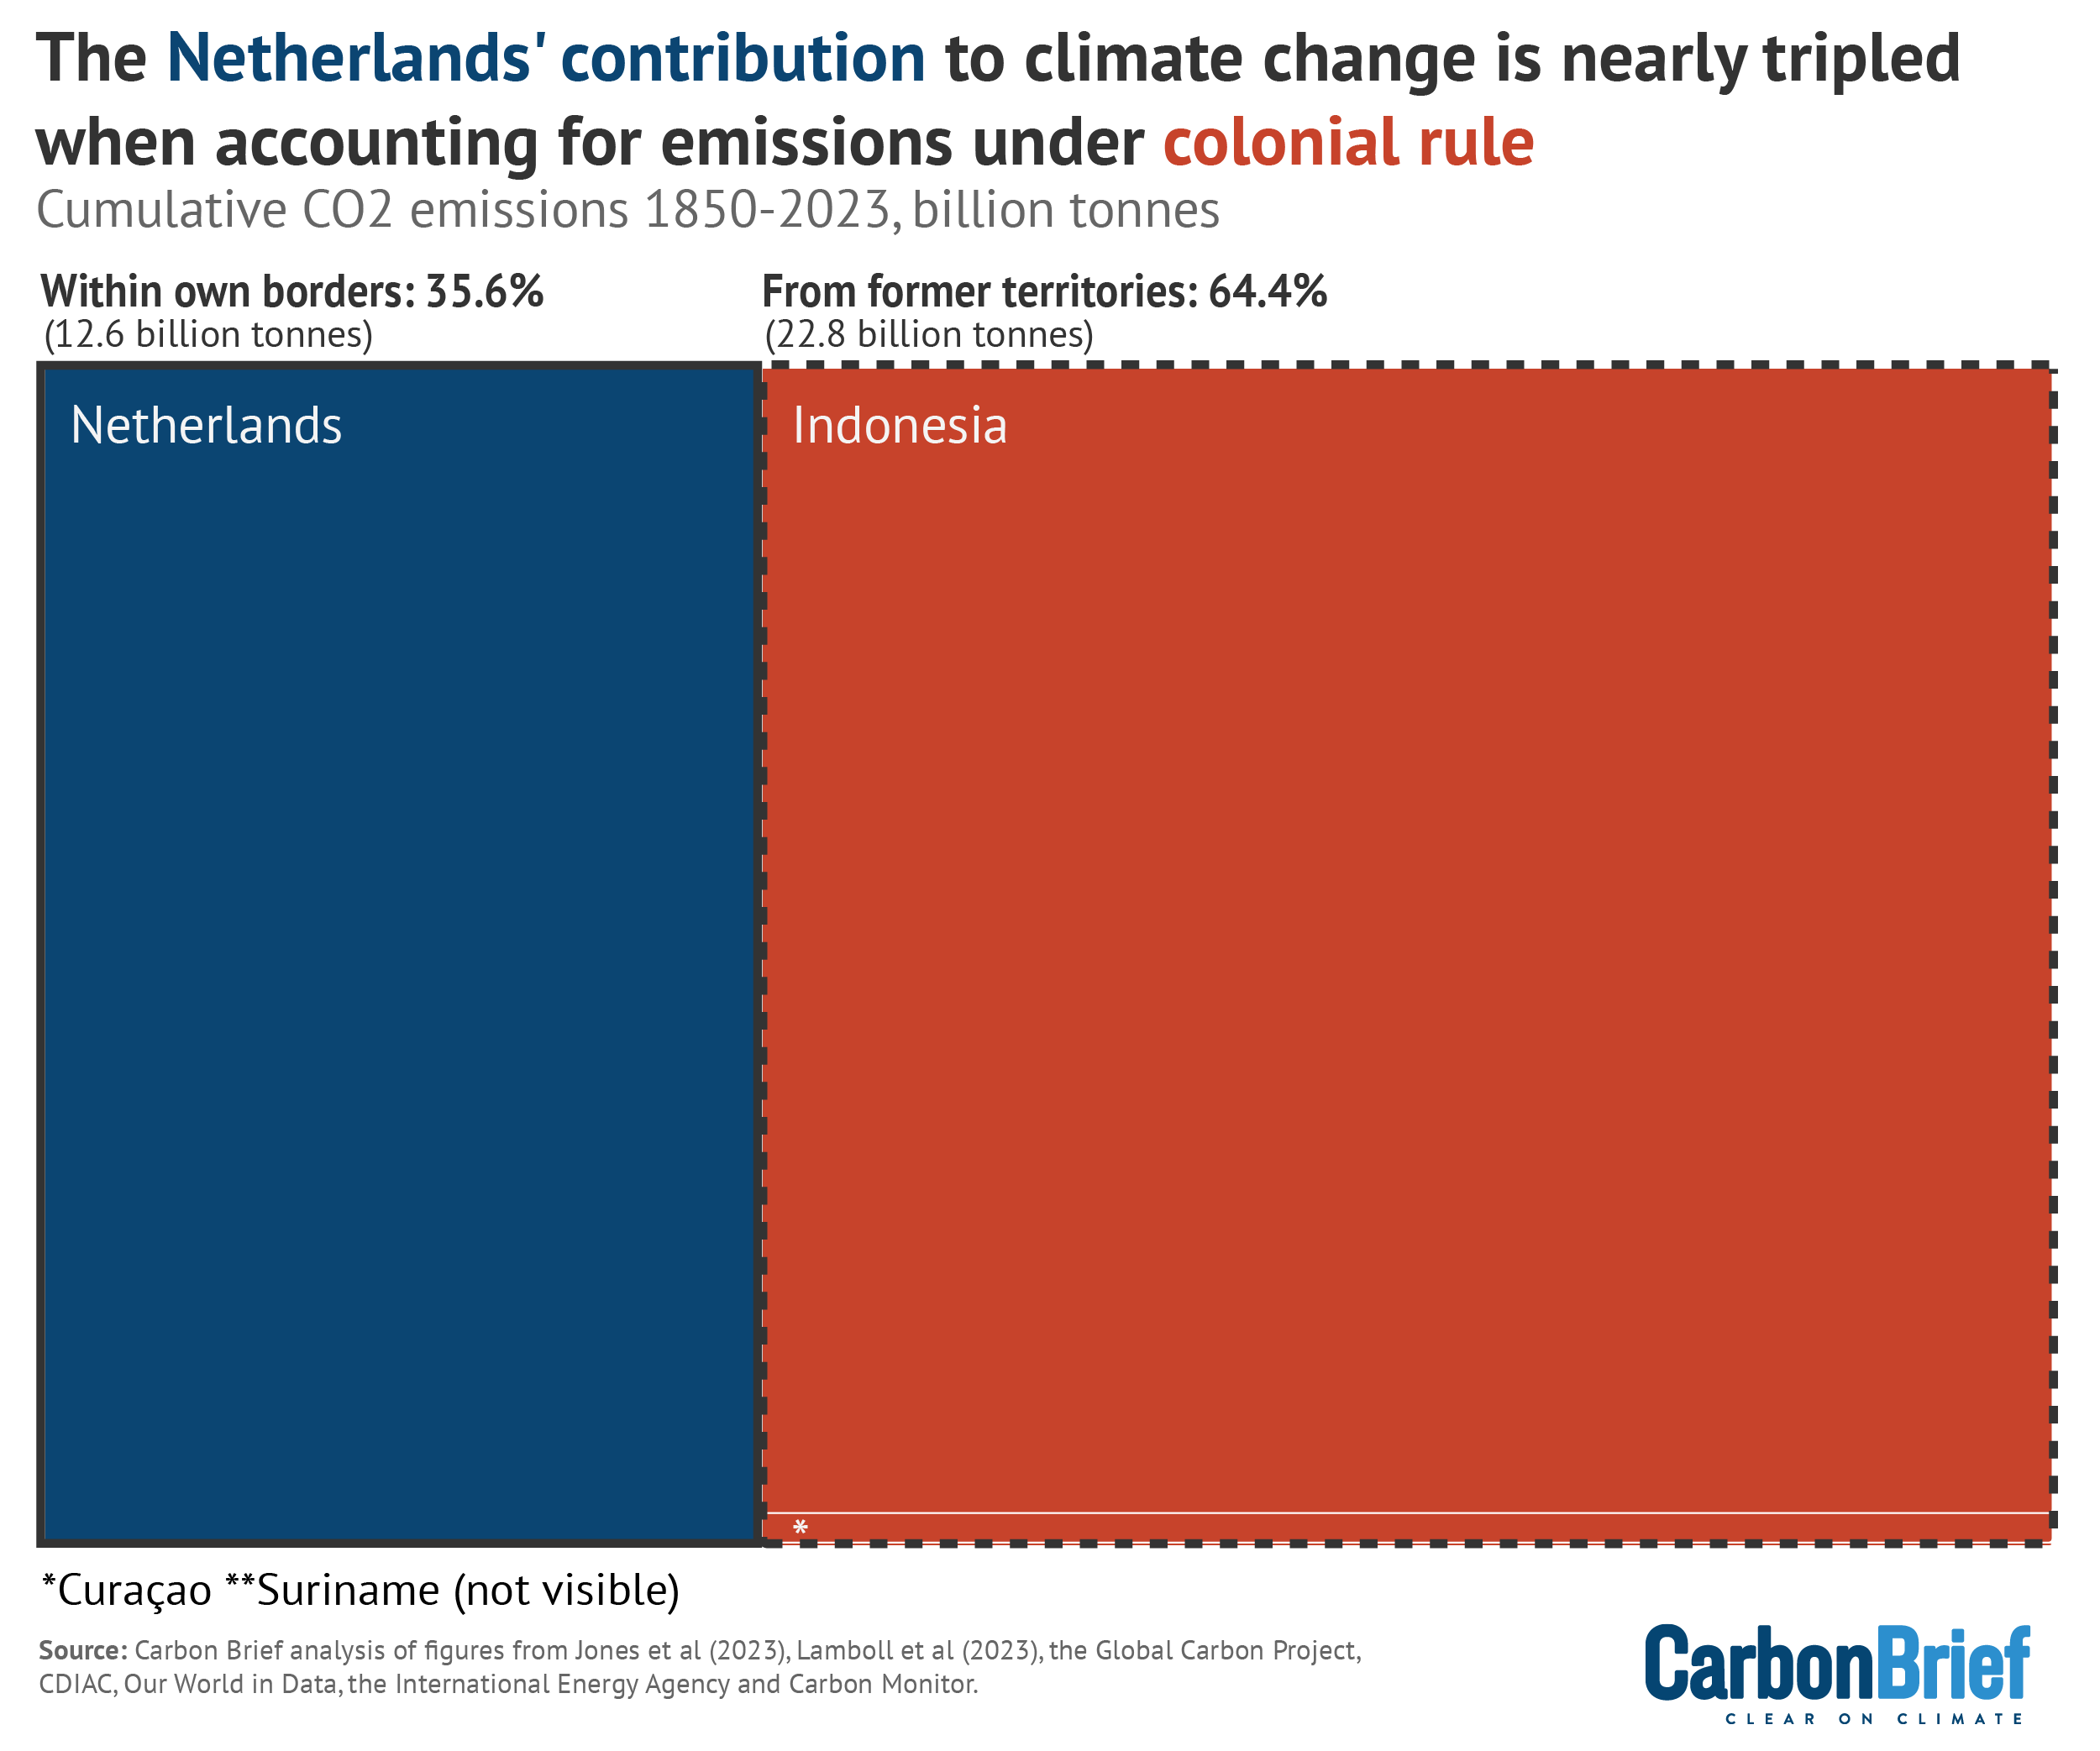
- The Netherlands accounts for nearly three times as much warming when accounting for colonial emissions (35GtCO2 and 1.4% of the total, rather than 13GtCO2 and 0.5%). This is largely due to LULUCF emissions in Indonesia, under Dutch rule, of 22GtCO2.
- Africa – the vast majority of which was under colonial rule – sees its share of historical emissions fall by nearly a quarter, from 6.9% to 5.2%. Despite a 21-times larger population, this 5.2% share is only fractionally higher than the UK’s 5.1%.
- When weighted by current populations, the Netherlands (2,014tCO2 per person) and the UK (1,922tCO2) become the world’s top emitters on a cumulative per-capita basis. They are followed by Russia (1,655tCO2), the US (1,560tCO2) and Canada (1,524tCO2).
- On this per-capita measure, China (217tCO2 per person), the continent of Africa (92tCO2) and India (52tCO2) are far behind developed nations’ contributions to warming.
- Many former colonial powers are also net CO2 importers today. While data on CO2 imports and exports is limited, available figures further raise their shares of historical emissions.
These findings reinforce the significant historical responsibility of developed countries for current warming, particularly the former colonial powers in Europe.
While they account for less than 11% of the world’s population today, together, the US, EU and UK are responsible for 39% of cumulative historical emissions and current CO2-related warming.
Many of these countries now have small and declining emissions. Yet their relative wealth today – and their historical contributions to current warming – are recognised within the international climate regime as being tied to a responsibility to lead, not only in terms of cutting their own emissions, but also in supporting the climate response in less developed countries.
The article below sets out why cumulative CO2 matters, how colonial rule changes responsibility for warming and where colonial emissions come from. It then looks at the impact of weighting emissions on a per-capita basis and accounting for emissions embedded in traded goods.
The article also includes a sortable, searchable table showing these key metrics for each country, as well as further details on the methodology used to produce this analysis.
- Why cumulative CO2 matters
- How colonial rule changes responsibility for warming
- Where colonial emissions come from
- How population size affects responsibility for warming
- How emissions imports and exports affect responsibility for warming
- Table: Historical emissions and colonial responsibility
- Methodology: Historical emissions and colonial responsibility
- Methodology: Why this analysis starts in 1850
Why cumulative CO2 matters
There is “unequivocal” evidence that humans have warmed the planet, causing “widespread and rapid” changes to Earth’s oceans, ice and land surface, according to the latest Intergovernmental Panel on Climate Change (IPCC) sixth assessment report.
The summary for policymakers states that current warming has been caused by “more than a century of net GHG [greenhouse gas] emissions from energy use, land-use and land use change, lifestyle and patterns of consumption, and production”.
Global warming is virtually certain to reach a new record high in 2023. Yet global greenhouse gas emissions have also climbed to record levels.
Meanwhile, climate change to date is already causing widespread impacts that disproportionately affect low-income countries, from deadly heatwaves and droughts to “catastrophic” ice loss.
Human-caused CO2 emissions are the largest contributor to warming and there is a direct, linear relationship between the amount of CO2 released and the warming of the Earth’s surface.
Moreover, the timing of a tonne of CO2 being emitted has only a limited impact on the amount of warming it will ultimately cause. Once emitted, the resulting increase in atmospheric CO2 levels is essentially permanent on human timescales. This is despite the fact that individual CO2 molecules have a limited lifetime in the atmosphere, as they circulate around the carbon cycle.
As a result, CO2 emissions from previous centuries continue to contribute to the heating of the planet – and current warming is determined by the cumulative total of CO2 emissions over time.
This is the scientific basis for the carbon budget, namely, the total amount of CO2 that can be emitted to stay below any given limit on global temperatures.
This analysis uses the latest estimates of the remaining carbon budget for a 50/50 chance of limiting warming to less than 1.5C above pre-industrial temperatures.
The carbon budget is now smaller than the figure used in Carbon Brief’s 2021 analysis, due to updated understanding of the warming impact of non-CO2 greenhouse gases.
Adding up all of the human-caused CO2 emissions tracked in this analysis, during 1850-2023, amounts to 2,558GtCO2. (See: Methodology: Why this analysis starts in 1850.)
This means the remaining carbon budget for 1.5C will be just 208GtCO2 by the end of 2023. Less than 8% of the budget will be left – and the entire budget would be used up within less than five years, if global CO2 emissions were to continue at current levels.
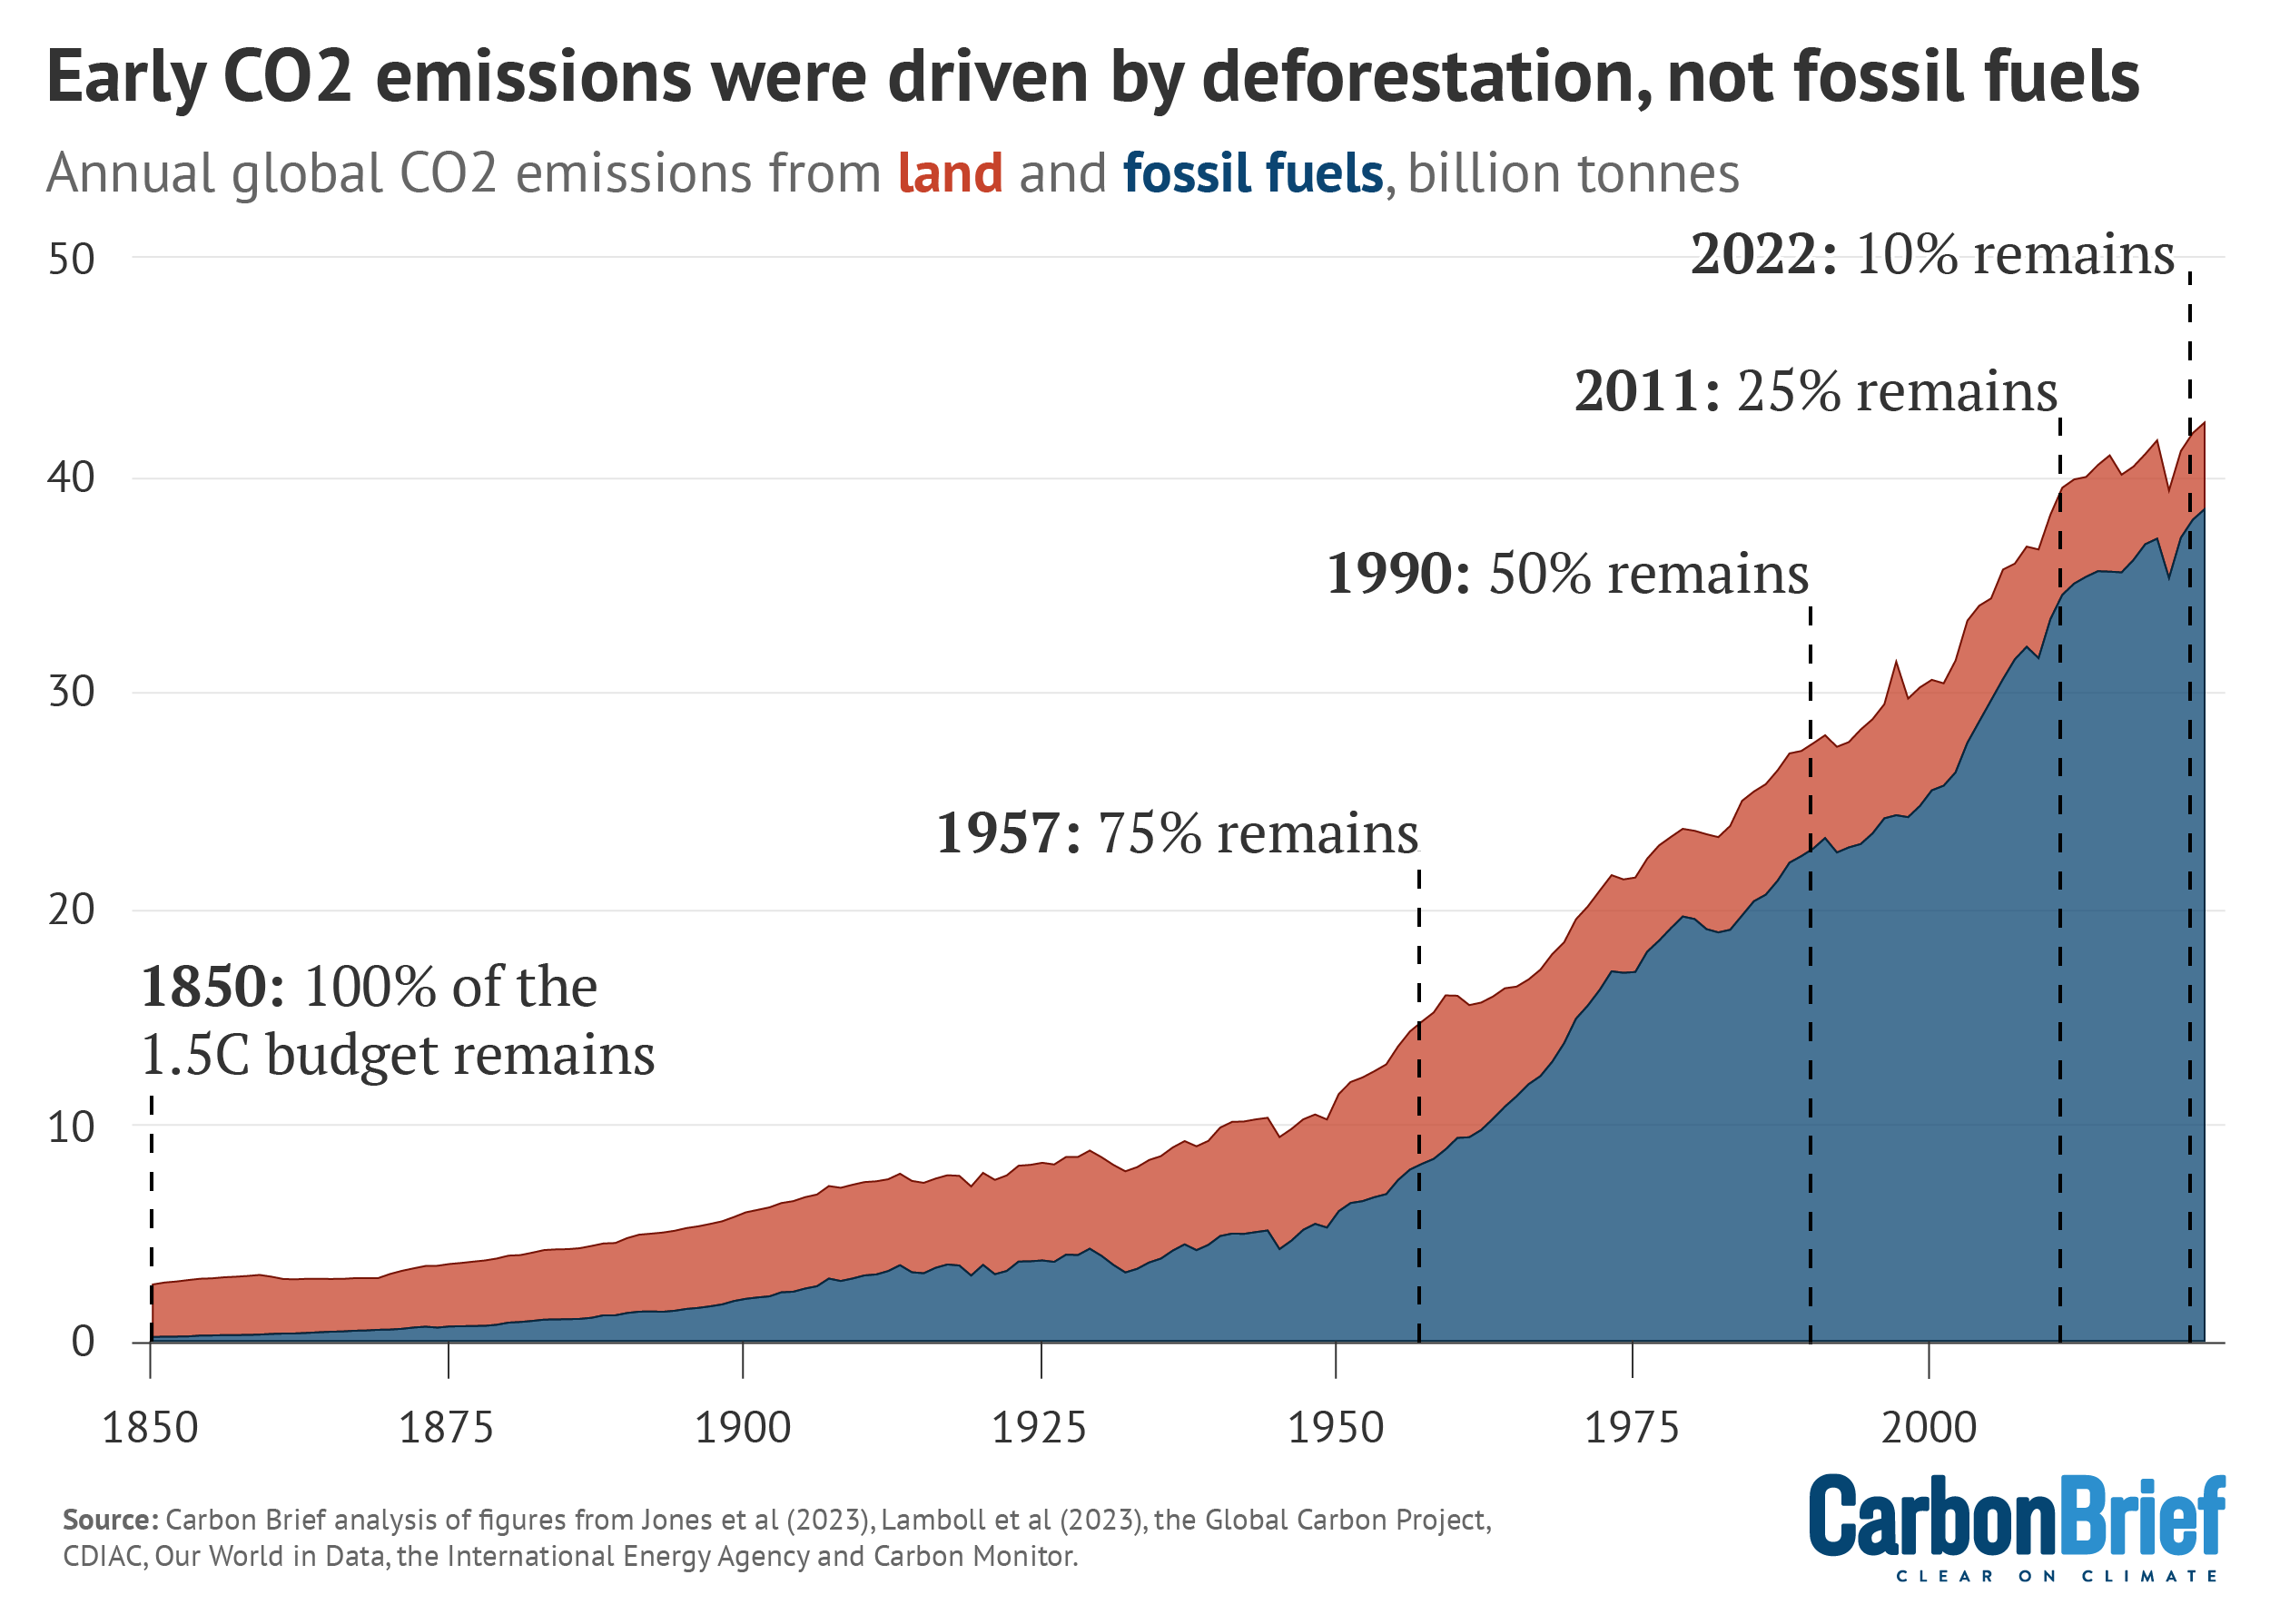
In the first decade covered by Carbon Brief’s analysis, land-related emissions including deforestation account for more than 90% of the CO2 being released each year.
This pattern is reversed in the present day, with fossil fuels and cement production accounting for an estimated 91% of global CO2 emissions in 2023, as shown in the figure below.
Annual global CO2 emissions from fossil fuels and cement overtook land-related emissions for the first time in 1947 – coincidentally, the year that India and Pakistan gained independence.
Overall, fossil fuels and cement account for more than two-thirds of cumulative CO2, some 71% of the total emissions released during 1850-2023. Land use and forestry account for the other 29%.
Carbon Brief’s estimates of cumulative emissions since 1850 – and the remaining carbon budget as of the present day – are fully aligned with the latest updates since the IPCC report in 2021.
The accelerating depletion of the carbon budget for 1.5C is illustrated by markers in the figure above, showing the years when 25%, 50% and 75% of the budget had been used up.
This shows that it took 107 years to use up the first quarter of the carbon budget, then just 33 years to use up the next quarter and only a further 22 years for the third quarter.
At the current rate, the final quarter of the 1.5C budget will have been used up in 16 years.
How colonial rule changes responsibility for warming
Historical responsibility is ethically complex, but it is clear that colonial powers had a significant influence on landscapes, natural resource use and development patterns taking place under their rule. It would be hard to justify ignoring this completely.
Indeed, it is well known that colonial powers extracted natural resources from colonised lands to support their economic, military and political power.
Yet the link to historical emissions has never been quantified, until now.
This analysis assigns full responsibility for past emissions to those with ultimate decision-making authority at the time, namely, the colonial rulers. This reverses the implicit assumption of previous analyses, where none of the responsibility was given to colonial powers.
Arguably, the true share of responsibility for current warming lies somewhere between these two extremes, where emissions are fully assigned to either the colonial powers or their former colonies.
In line with this approach, the analysis assigns responsibility for emissions within the former Soviet republics to Russia, because decision-making authority was heavily centralised in Moscow.
The figure below shows the top 20 countries in the world in terms of their cumulative historical CO2 emissions. The blue columns show emissions taking place within each country’s current borders, while the red chunks show emissions that took place under its rule, in controlled territories. The light blue chunks show emissions reallocated from former colonies to the former colonial power.
Notably, the major post-colonial European powers, including the UK (+70%), France (+51%) and the Netherlands (+181%), all see significant increases in their share of historical emissions.
While they do not appear in the top 20, there are similar effects for Belgium (+33%), Portugal (+234%) and Spain (+12%). Collectively, the EU+UK take on much larger responsibility (+28%).
On the flip side, India (-15%) and Indonesia (-24%) are particularly notable for their reduced share of cumulative emissions, under this new approach to historical responsibility for warming.
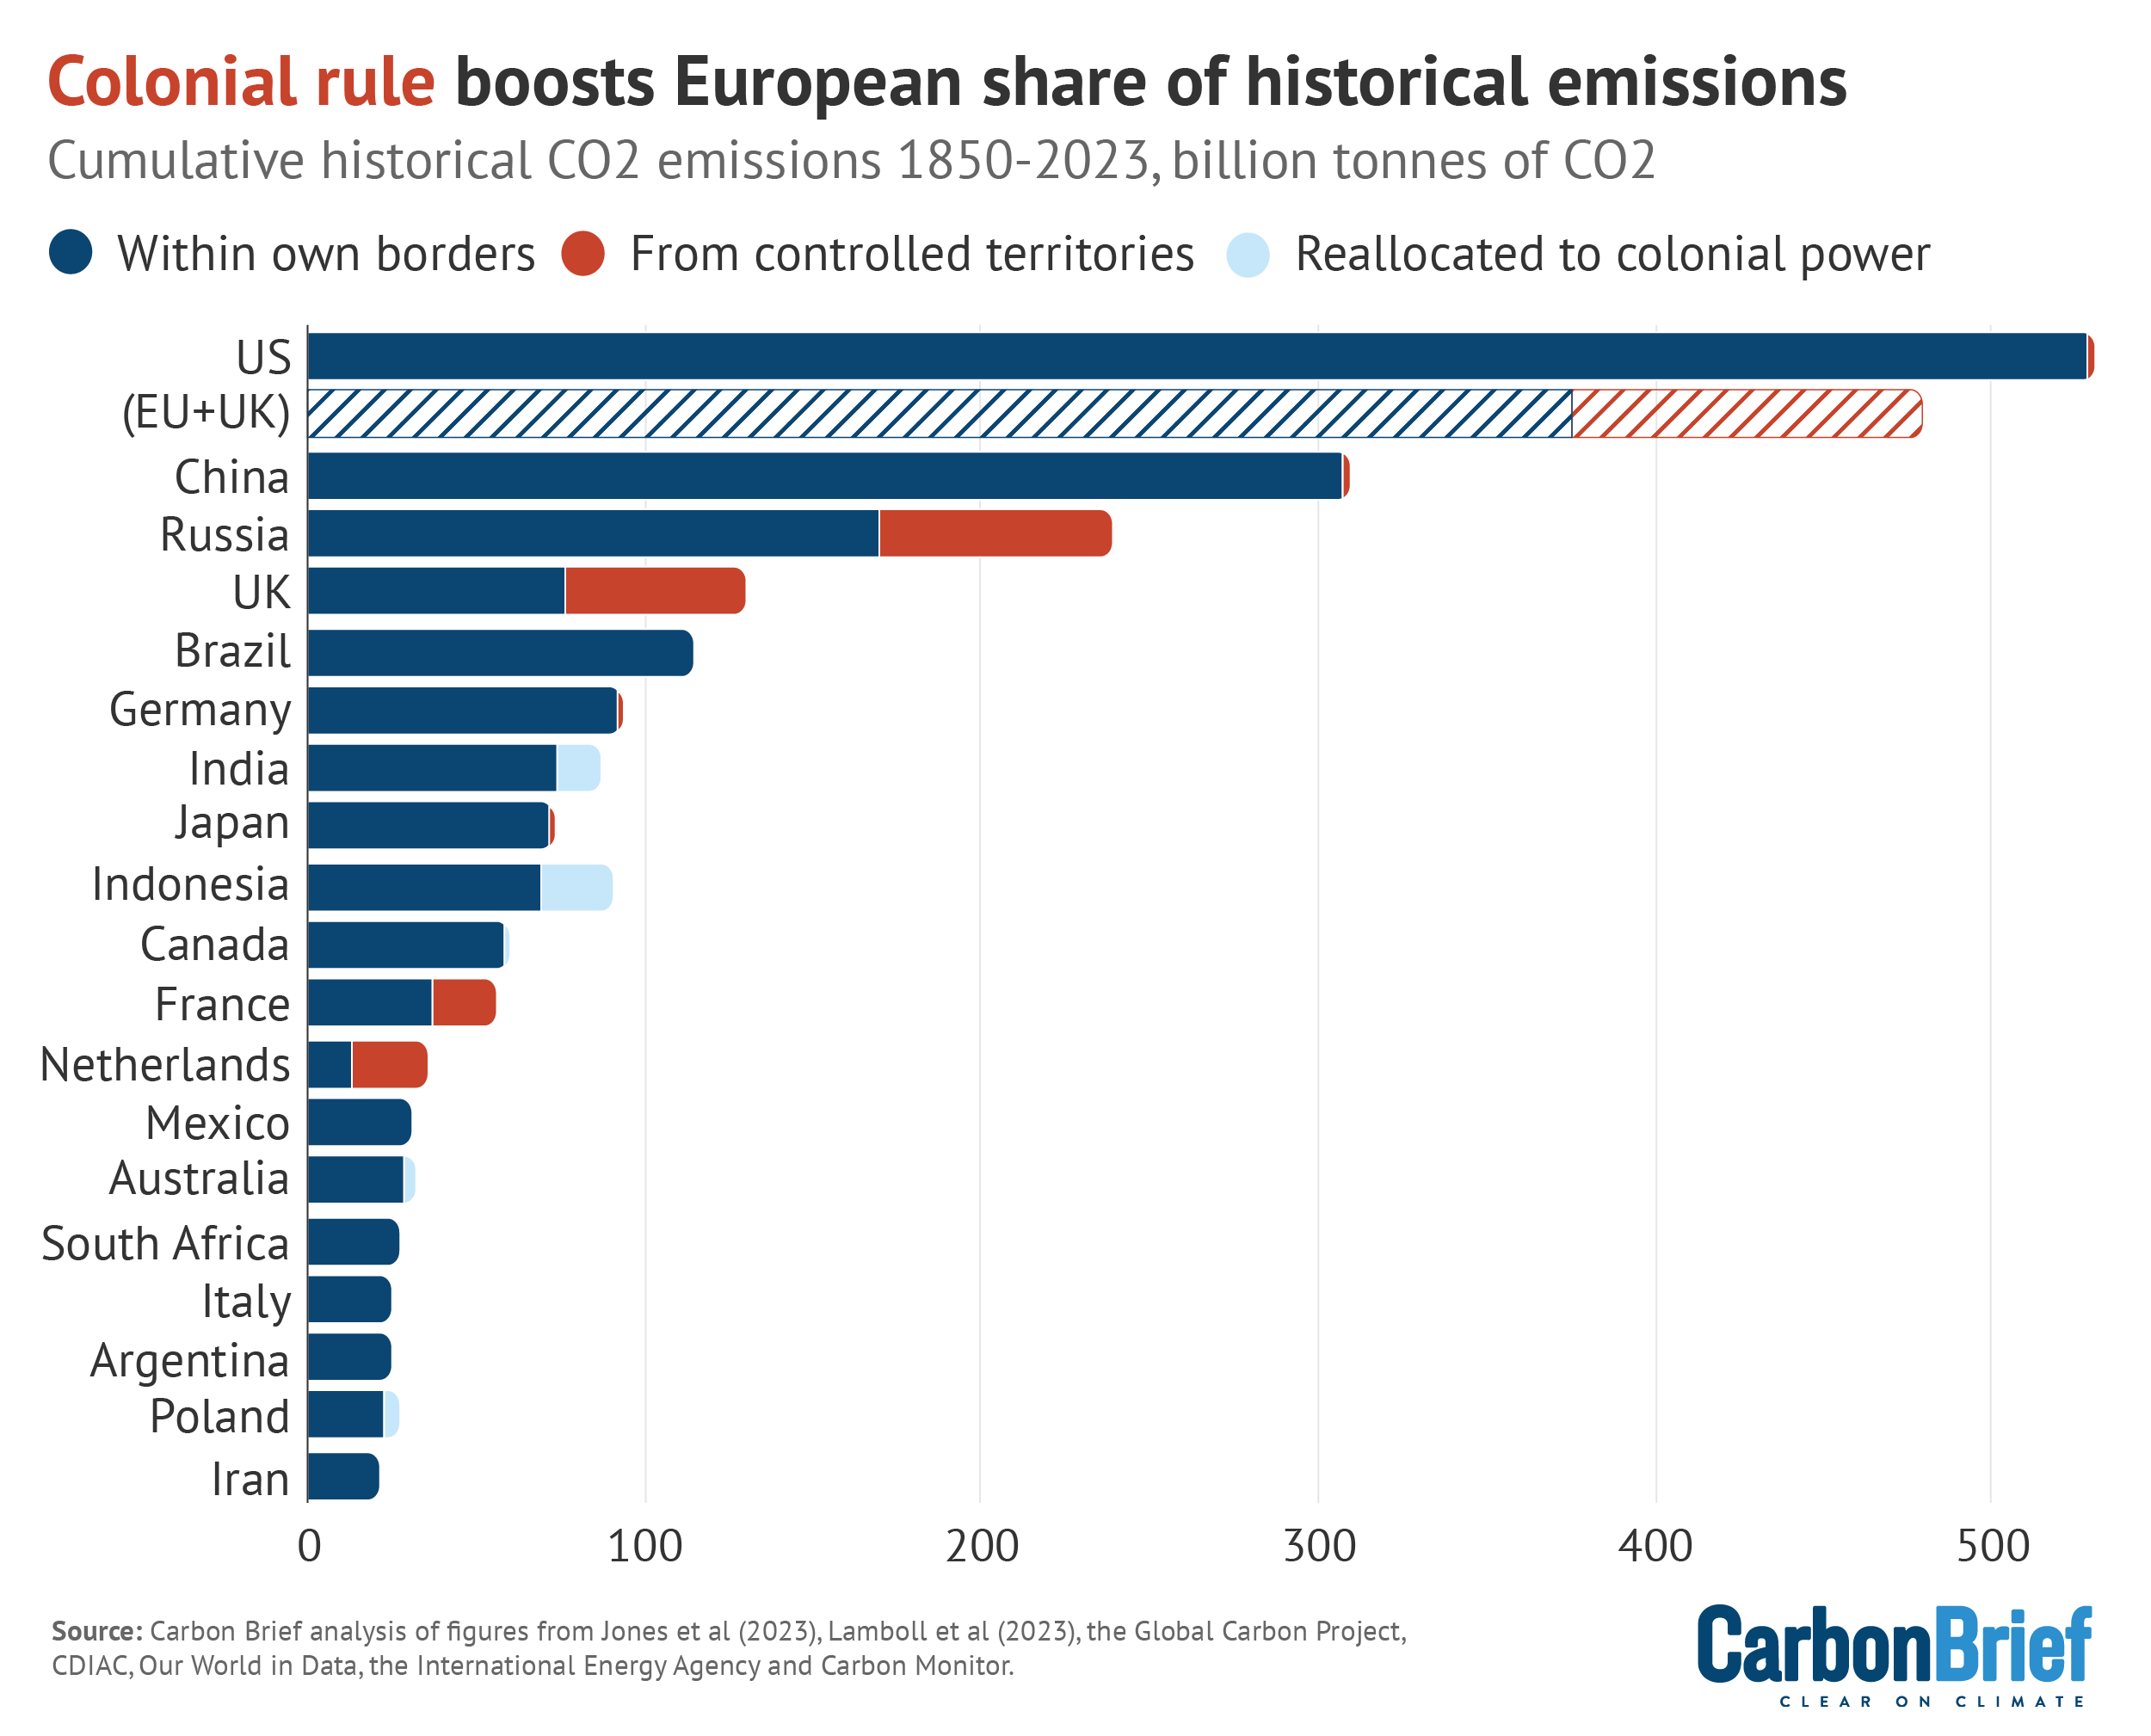
Russia also sees a significant increase in its historical responsibility for current warming, which rises by two-fifths to 9.3% of the global total, under the approach taken in this analysis.
Nevertheless, some argue that the nature of the power dynamics within the former Soviet Union was different to those between European colonialists and the peoples they colonised overseas.
While also not appearing in the top 20, there are big shifts, too, for Austria (+72%) and Hungary (+70%), as a result of the former Austro-Hungarian empire. This, too, was of a different nature to the overseas colonisations of other European powers.
Accounting for colonial rule alters the relative ranking of a number of countries.
The UK is the most prominent example, climbing from eighth-largest contributor to climate change to fourth. This means it leapfrogs its former colony, India, in terms of past responsibility.
Similarly, while the Netherlands does not quite overtake Indonesia, their relative rankings are significantly different after accounting for colonial responsibility for past emissions.
These shifts are illustrated in the figure below, which shows the top 20 countries in the world ranked according to their share of cumulative emissions. On the left, only emissions within present-day borders are considered, while on the right, emissions under colonial rule are added.
(Note that the EU+UK is shown as a bloc, in addition to the top 20 countries.)
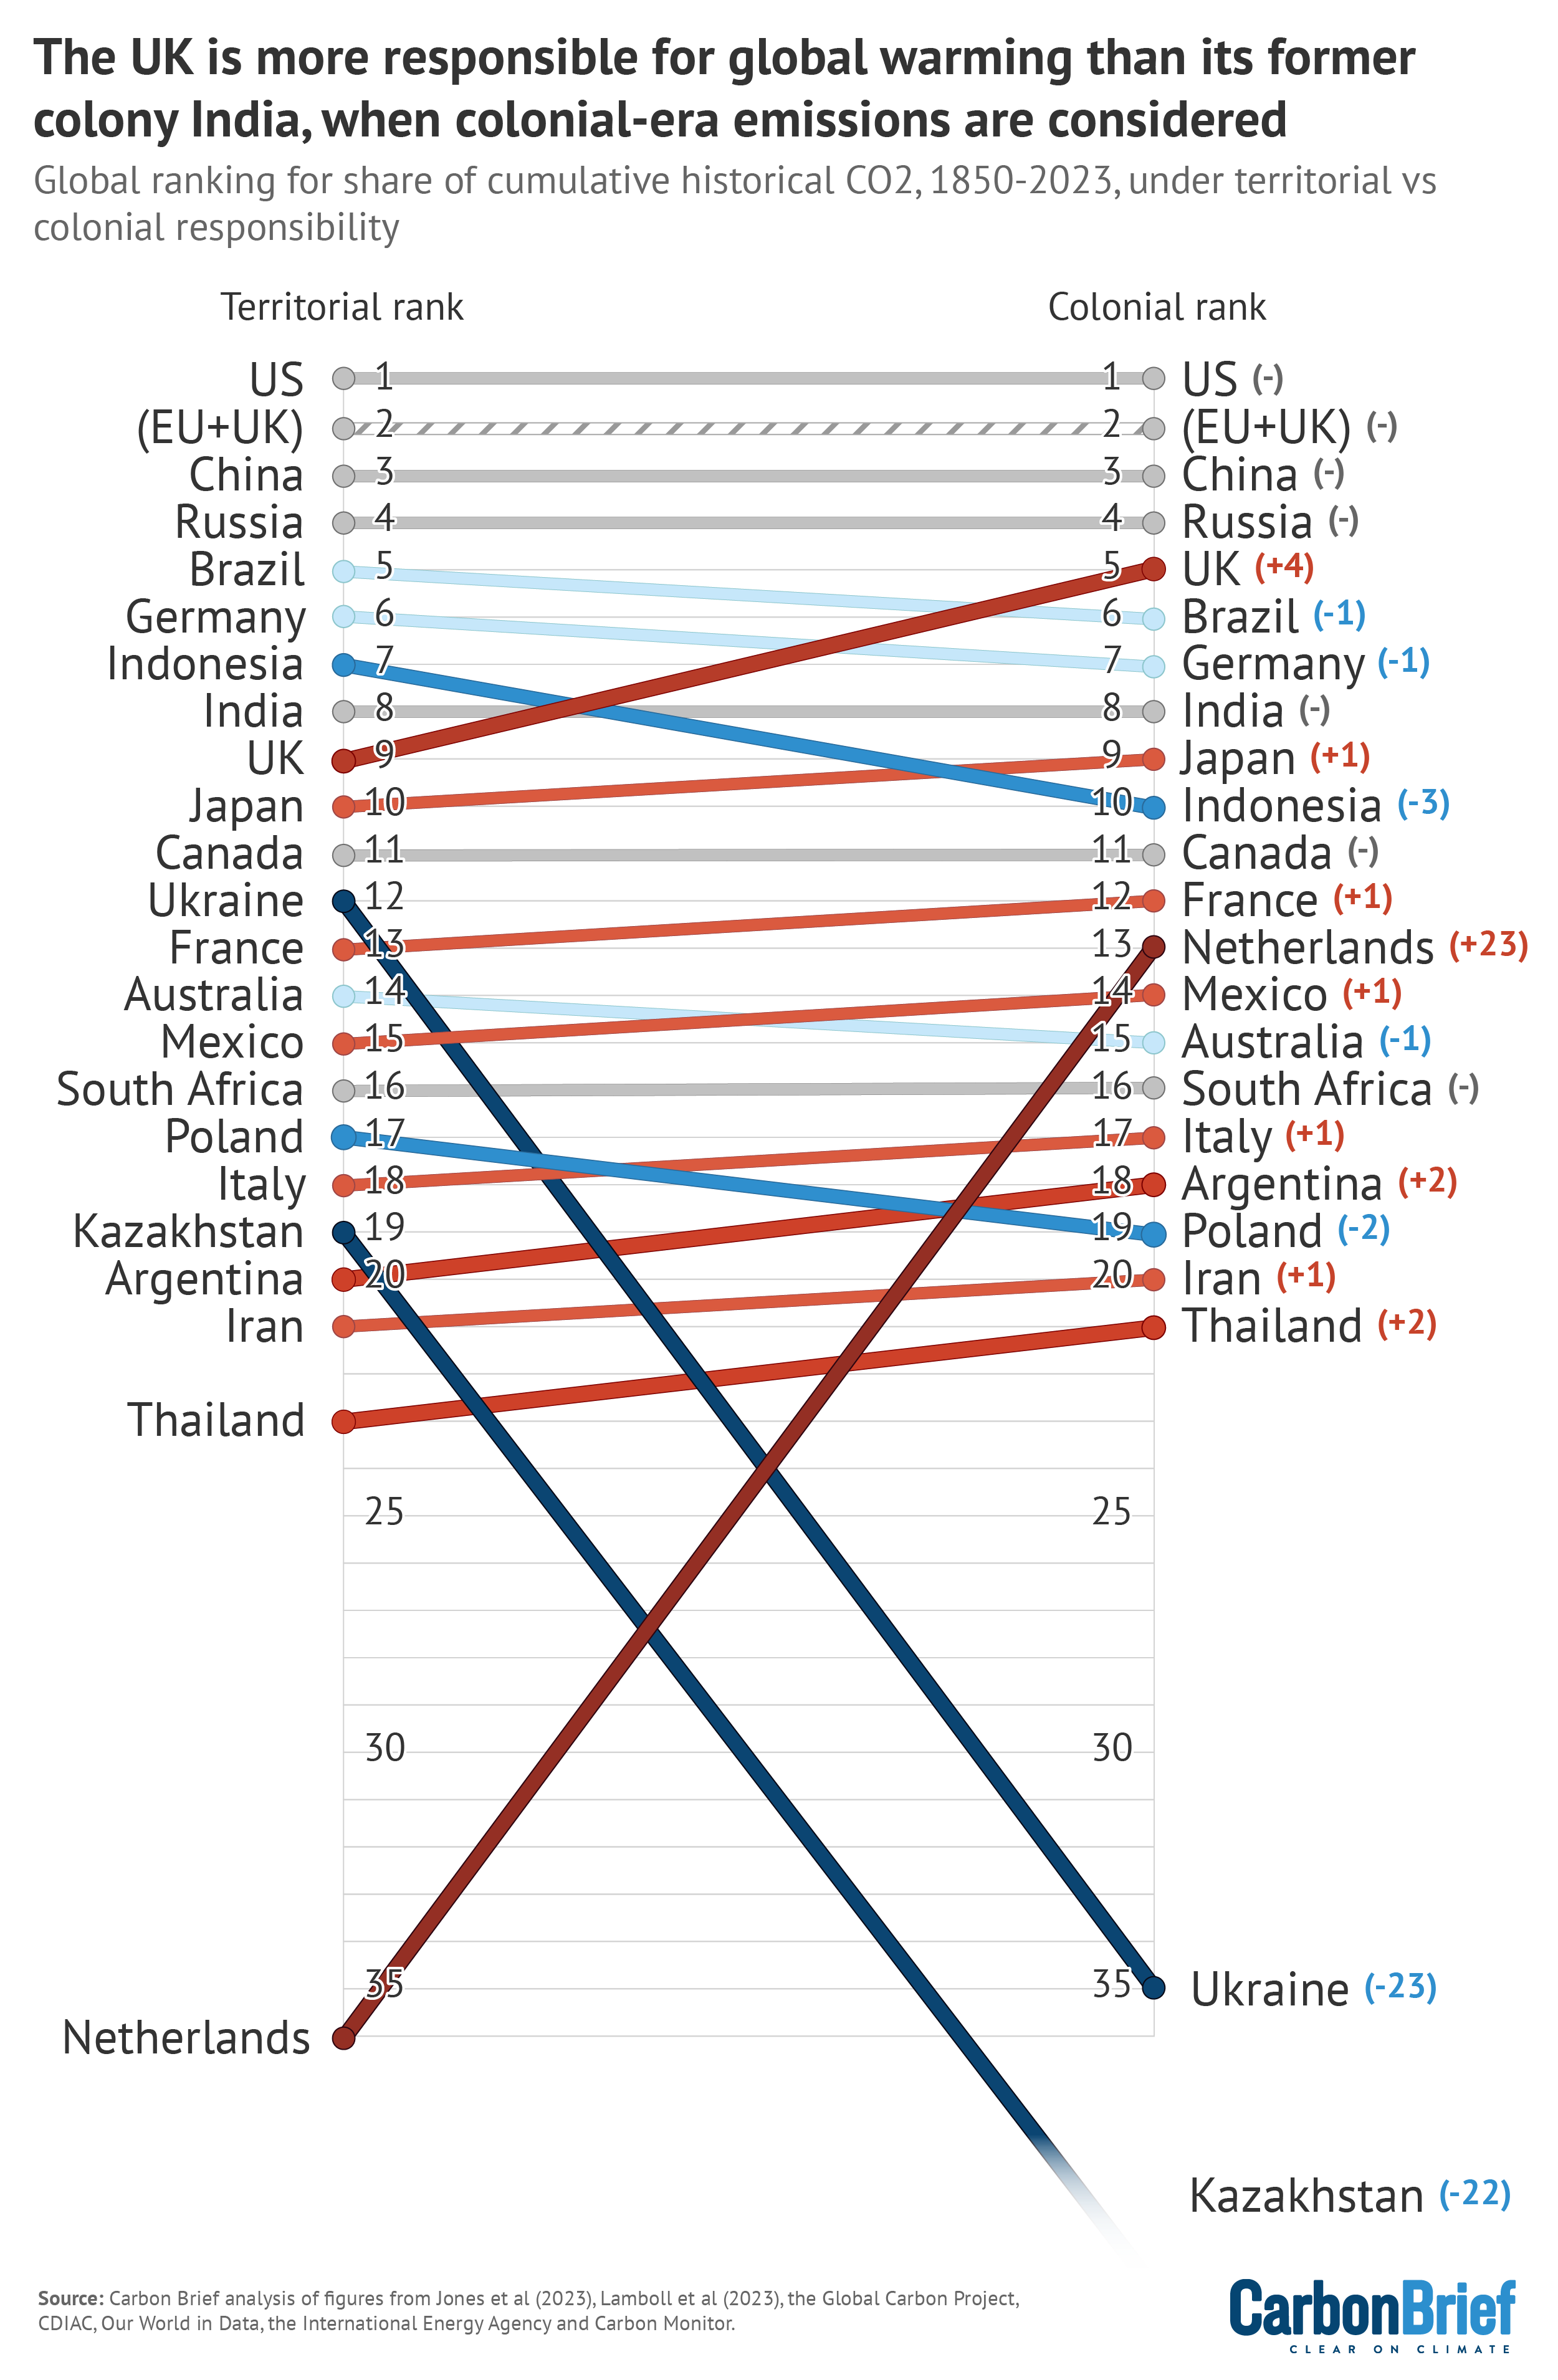
The other obvious shifts in the ranking chart, above, are for Ukraine and Kazakhstan, both former Soviet republics that were under centralised rule from Moscow for much of the 20th century.
Unlike other emissions reassignments under Carbon Brief’s new analysis, these and other former Soviet republics have large amounts of fossil fuel-based CO2 emissions shifted off their books.
Referring back to the chart of fossil- versus land-based emissions over time, above, illustrates the major reason why this is the case. Annual CO2 emissions were dominated by contributions from LULUCF until the middle of the 20th century, when fossil fuel use started to explode.
Many former European colonies in Asia, Africa, Oceania and the Americas had gained independence well before the point when fossil fuel use accelerated. In contrast, former Soviet republics were part of the Soviet Union administered from Moscow until its collapse in 1991.
Where colonial emissions come from
The history of European imperialism is “inseparable from the history of global environmental change”, say Prof William Beinert and Lotte Hughes in their 2007 book Environment and Empire.
For the UK, one driver was what they describe as the “gradual domestic deforestation” of the country, which “hastened dependence on coal for energy” and drove demand for timber imports.
In turn, the shift to machine power based on fossil fuels “enormously expanded the possibilities of metropolitan production and consumption [and] facilitated a new surge in imperial expansion, carried by steamships, railways, and motor vehicles”. They write:
“Metropolitan countries sought raw materials of all kinds, from timber and furs to rubber and oil. They established plantations that transformed island ecologies. Settlers introduced new methods of farming; some displaced Indigenous peoples and their methods of managing the land.”
This hunger for natural resources drove deforestation and environmental change in colonised lands, from the Americas and the Caribbean to Asia, Africa and Oceania.
In Barbados, for example, the establishment of plantations “necessitated destroying the forests…with a combination of ring-barking and burning”, according to the book.
Similarly, in Madeira, “one of the founding myths recalled by…colonists was a fire that burned for seven years – a powerful metaphor for deforestation”.
Yet, as colonial forests were denuded of their ability to produce high-quality timber, colonisation also led to the beginnings of “conservationist practices and ideas”, Beinart and Hughes write:
“[W]hile natural resources have been intensely exploited, a related process, the rise of conservationist practices and ideas, was also deeply rooted in imperial history. Large tracts of land have been reserved for forests, national parks or wildlife.”
The British empire was particularly far-reaching, controlling around a quarter of the Earth’s land surface at its peak by the end of the 19th century – and more than a quarter of its population.
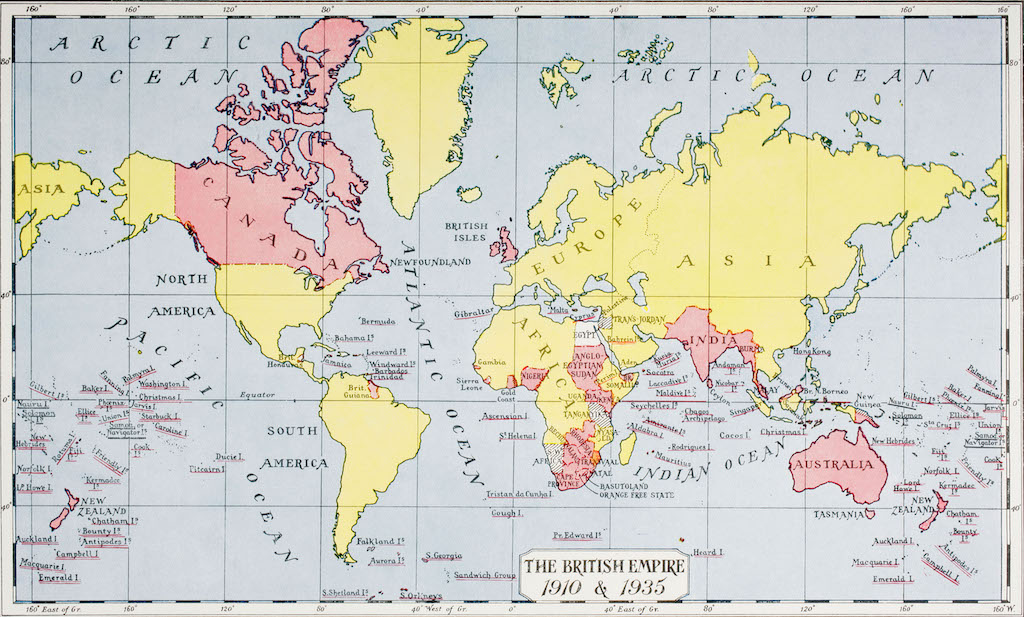
In Carbon Brief’s new analysis, emissions under British rule in 46 former colonies are reassigned to the UK, almost doubling its share of the global historical total.
This is illustrated in the figure below, with notable contributions coming from India and Myanmar through to countries such as Australia, Canada, Tanzania, Zambia and COP28 hosts the United Arab Emirates.
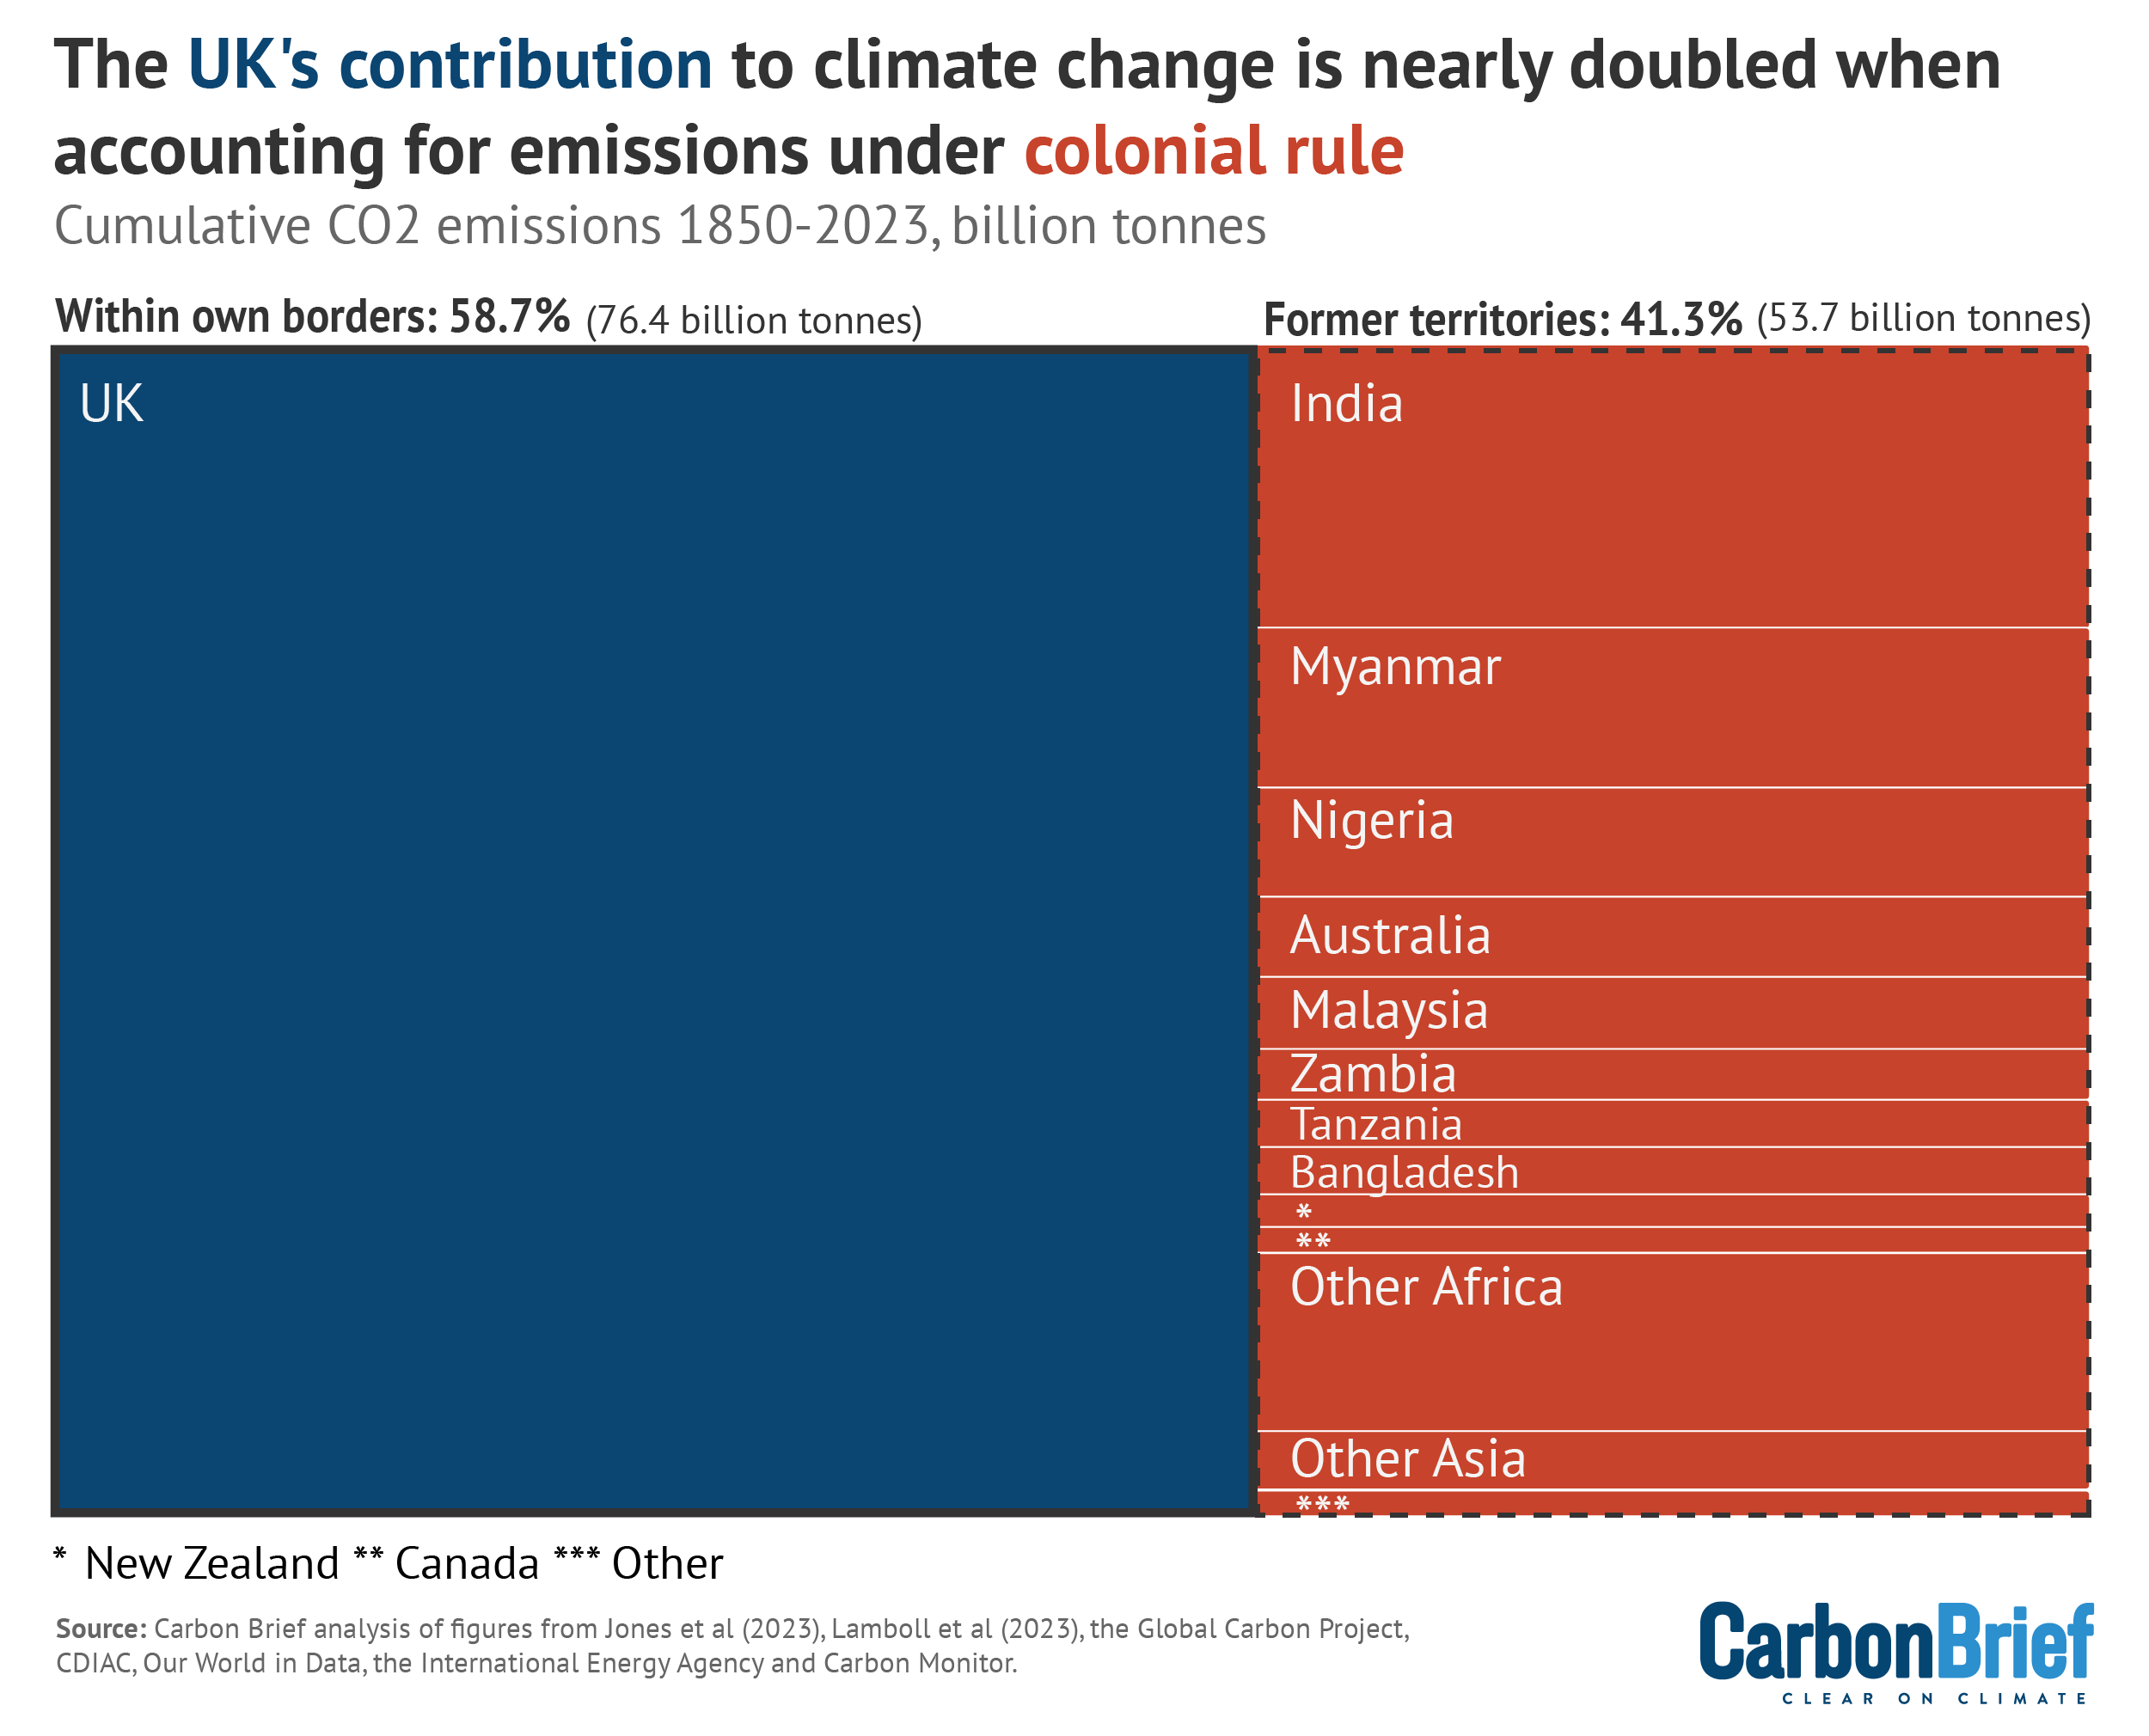
The largest contribution to the UK’s colonial emissions is from India, as shown in the figure above, with the second largest being from Myanmar.
In their book, Beinart and Hughes describe the intimate links between the colonisation of these countries and the exploitation of their natural resources, with the two interacting and reinforcing each other, as resources were used to further cement British control. They write:
“Indigenous hardwoods were the prime riches…essential to the British army, navy and railways, they became cogs in the conquest of India. The new demands inevitably led to deforestation…Railways, [which were at the heart of domestic timber demand in India,] were critical for moving troops and thereby controlling territory. Rolling back the forests to make way for cultivation was also seen by the East India Company as a means of extending control.”
Beinart and Hughes also refer to the particular use of teak from Myanmar to make warships: “Burma or ‘Admiralty’ teak was known to be the strongest. Used for navy frigates, it was said to have saved Britain during the Napoleonic wars and aided her maritime expansion.”
Later, the depletion of Indigenous hardwood forests led to colonial conservation efforts, though the motives for doing this – and the means by which it was achieved – were decidedly mixed.
The book quotes Hugh Cleghorn, conservator of forests for the Madras presidency, writing in 1861 of the “careless rapacity of the native population…who cut and cleared [forests]…without being in any way under the control or regulation of authority”. It continues:
“When a[n Indian] Forest Department was established in 1864, Britain had few experts of its own. [German forester Dietrich] Brandis had been brought in two years previously from Burma, where he was credited from with saving the Burmese teak forests from timber traders, for the benefit of British shipbuilders…The conservators were under pressure to manage the forests effectively, meet the needs of the admiralty and others for large quantities of timber, simultaneously turn a profit, and contain local peoples’ claims on the forests…The British laid claim to territory they considered unoccupied and unclaimed, and regarded princely property as theirs by right of conquest.”
Similar dynamics were at play in Indonesia, which had long been under Dutch rule. The late historian of Indonesia Prof Peter Boomgaard wrote in a 1999 book chapter that deforestation on the Indonesian island of Java “began to be perceived as a problem around 1850”.
Boomgaard adds that this led to the establishment of a colonial forest service and the creation of protected forests. This pattern, which has included the confiscation of lands and the exclusion of Indigenous peoples in the name of conservation, has been repeated in many other former colonies.
The figure below show how cumulative emissions within the borders of the Netherlands (left), some 12.6GtCO2 between 1850-2023, are nearly tripled when taking into account emissions that took place under Dutch colonial rule – particularly in Indonesia (right).
Writing at his blog, Indonesian soil scientist Prof Budiman Minasny describes the impact of Dutch colonial rule on the island of Sumatra:
“When we talk about deforestation, Indonesia always came up as the main culprit. Less talked about is [the] Dutch root of deforestation in Indonesia…The Dutch discovered the tobacco industry in Deli in the 1860s and created an industrial-scale plantation system. The local sultans collaborated and gave concessions of 1,000–2,000 hectares of land to each company in a 75-year lease. The Dutch colonial planters assumed that tobacco could only grow well in the soil that had just been cleared from the virgin jungle. Thus, the industry drove large-scale virgin forests clearing to produce tobacco leaves exported to Europe and America.”
The ongoing legacy of colonial rule is debated, but many of its vestiges remain, whether in the structure of state administrative functions or in the presence of commercial interests owned by multinationals based in former colonial powers.
As a 2015 paper explains, these colonial legacies continue to this day:
“Though colonialism was dismantled in the first half of the twentieth century, its policies on forest nationalisation remain unchanged across many independent states in the tropics including Nigeria.”
Concluding their chapter, Beinart and Hughes write of the British imperial legacy on India:
“British imperial control of India had a major impact on its extraordinarily varied range of trees and forest products. It also restricted access to forests by poor people…That later exclusion of humans from wildlife parks was also partly rooted in the forest laws of the colonial people, which treated local people as wasteful and destructive…But pressures on the forest did not end with independence. The current rate of deforestation is said to be well over one million ha every year.”
How population size affects responsibility for warming
Overall cumulative emissions are what matters for the atmosphere, given they relate directly to the level of warming being experienced today.
Still, from the perspectives of fairness, equity and climate justice – since national borders are arbitrary political constructs – it is also appropriate to consider responsibility at the individual level.
This involves weighting national cumulative emissions totals by their respective national populations, in order to calculate per-capita cumulative emissions.
As in Carbon Brief’s previous article, this analysis uses two alternative approaches to account for relative population sizes. Colonial responsibility alters both sets of figures dramatically.
The first approach takes a country’s cumulative emissions to date and divides it by the population in 2023. The results are in the figure below, showing the top 10 emitters and five selected others.
Per-capita emissions within each country’s borders are once again shown in blue, with per-capita emissions occurring in former territories under colonial rule shown in red. Per-capita emissions reallocated to a colonial power are shown in light blue.
Notably, former colonial powers the Netherlands (2,014tCO2 per person) and the UK (1,922tCO2) are the world’s top emitters on this per-capita cumulative basis. They are followed by Russia (1,655tCO2), the US (1,560tCO2) and Canada (1,524tCO2).
The figure shows that colonial responsibility for emissions pushes the US and Canada down the rankings, from first and second, into fourth and third, respectively.
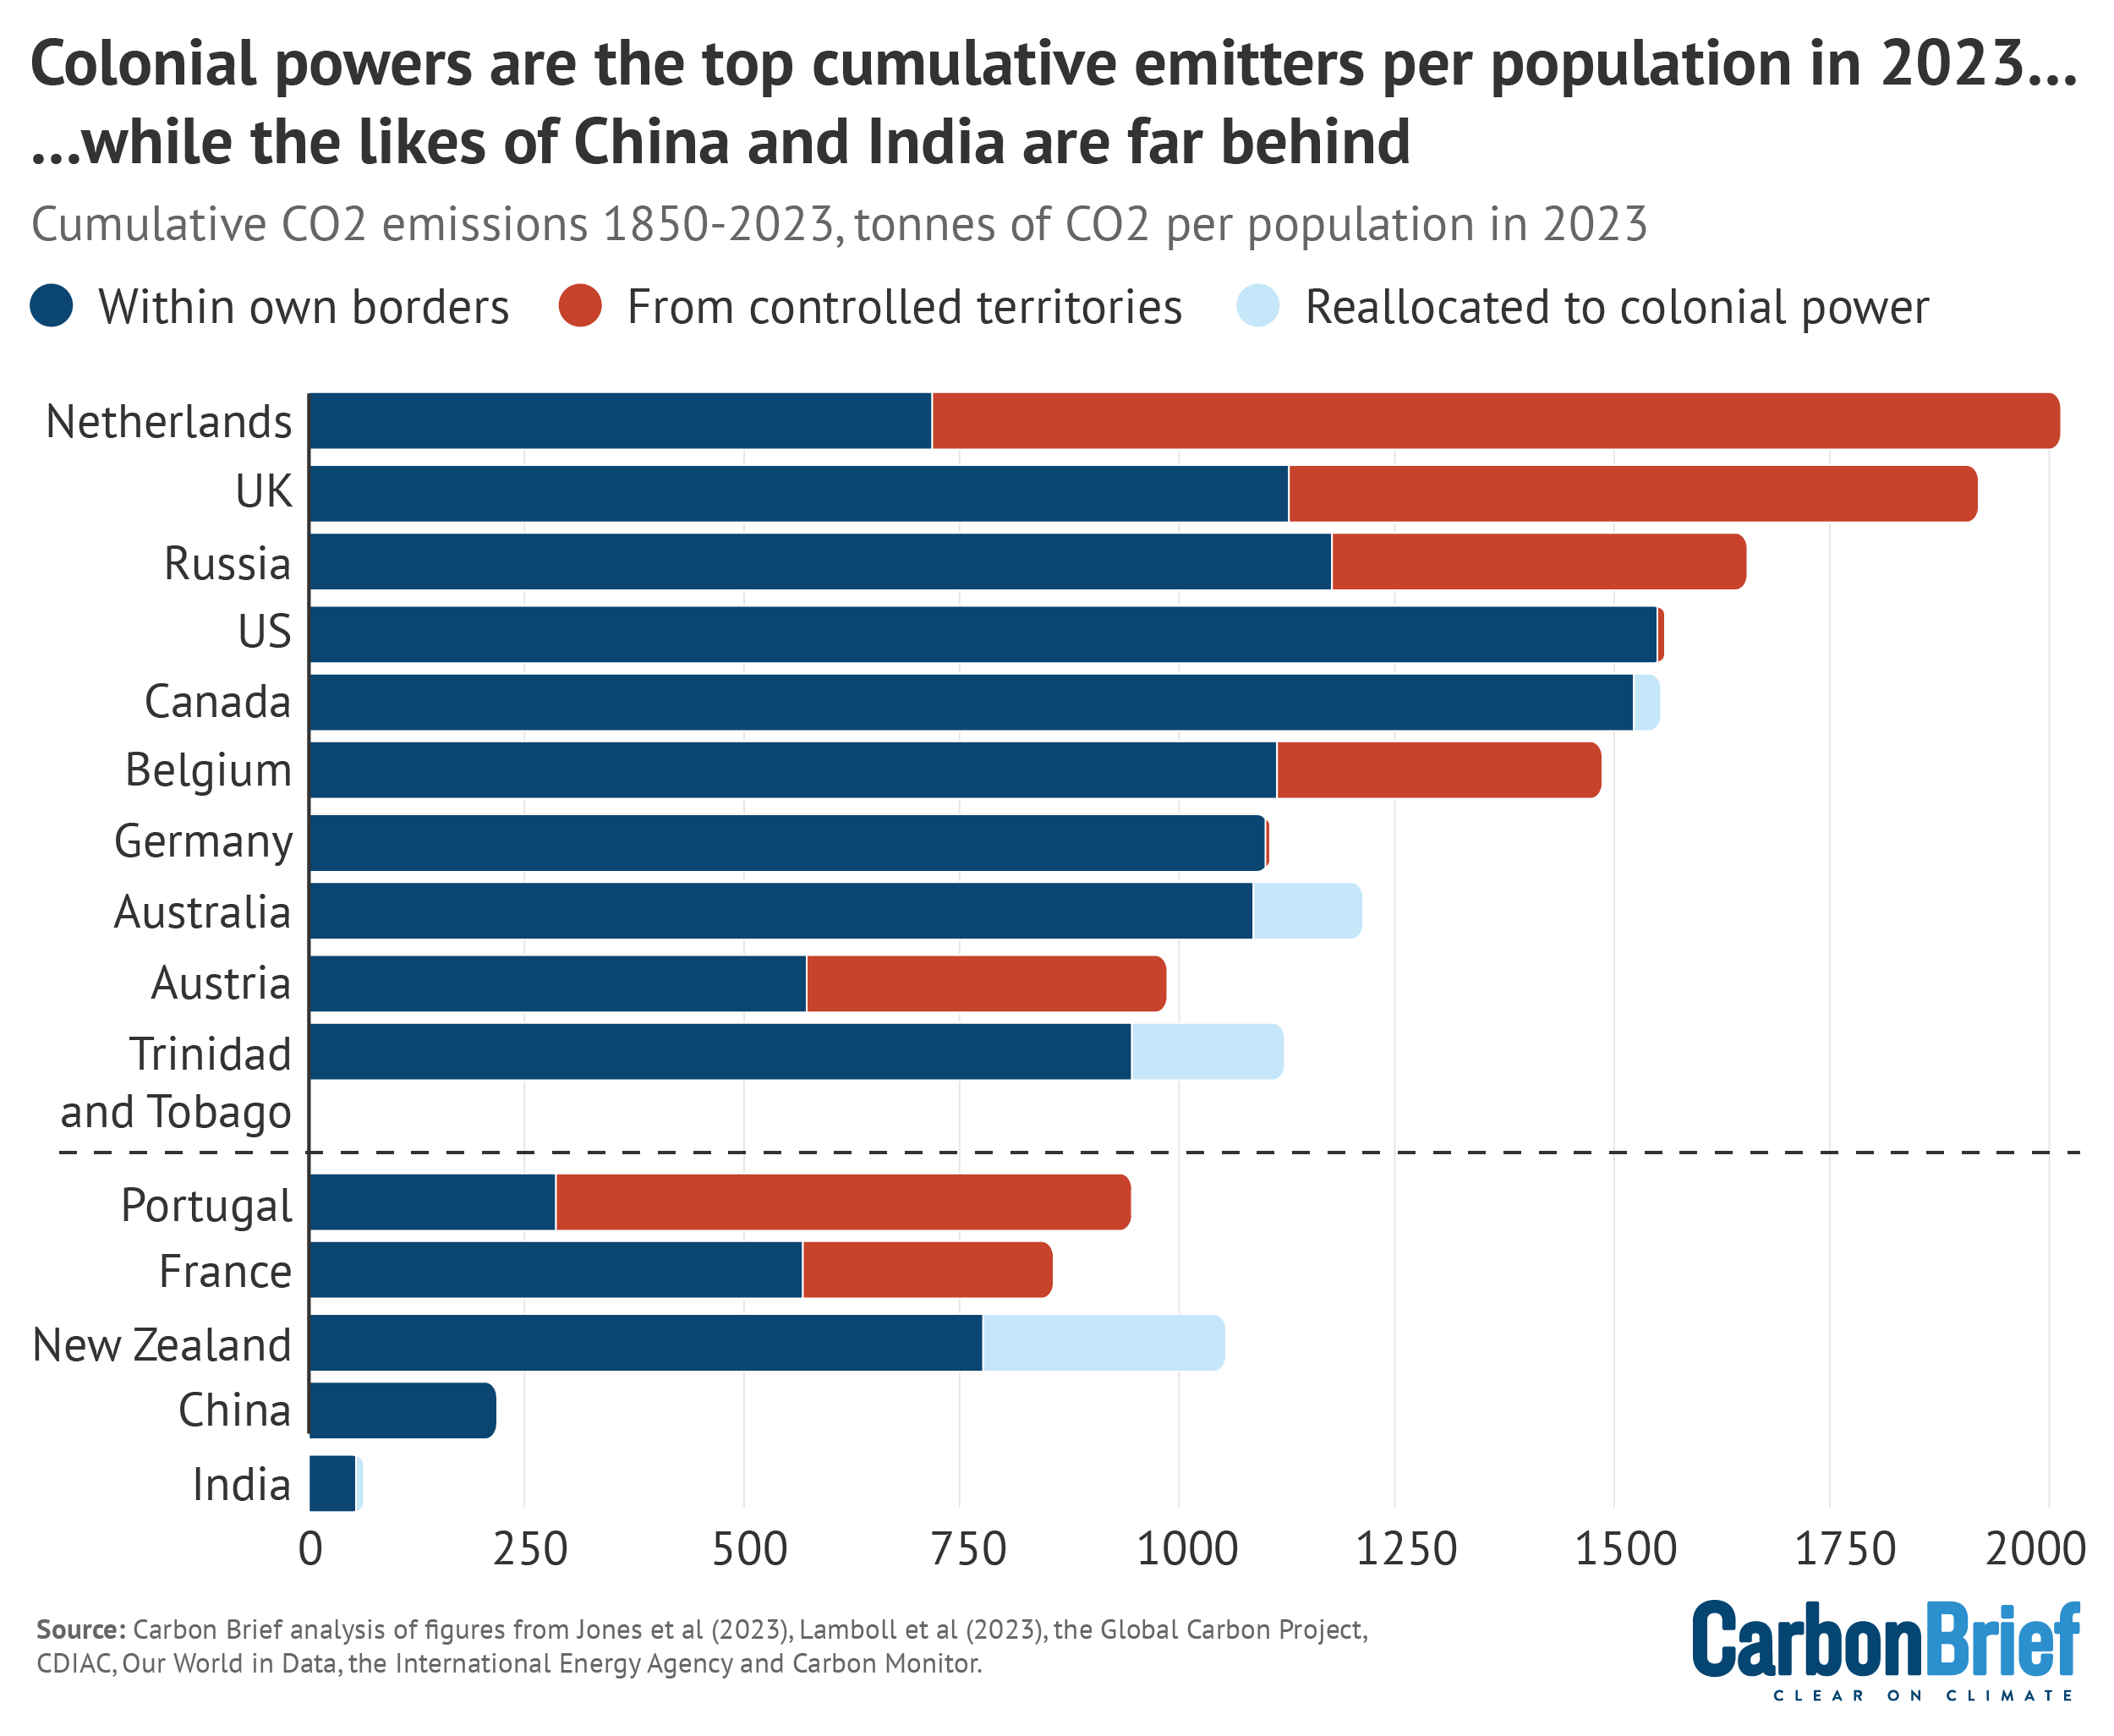
Other former imperial powers, including Belgium (1,487tCO2) and Austria (987tCO2) are also in the top 10, as are former colonies Australia (1,088tCO2, down 10% due to colonial emissions being reallocated) and Trinidad and Tobago (948tCO2, down 16%).
The figure also shows five other selected countries: Portugal (945tCO2) and France (857tCO2), with significant colonial footprints; as well as major emitters China (217tCO2) and India (52tCO2), which are far behind other nations on a per-capita basis.
Not shown on the chart is the average for the continent of Africa (92tCO2), which, like India’s, is many times lower than the global average of 318tCO2.
The second approach to weighting historical emissions by population takes a country’s per-capita emissions in each year and adds them up over time. This gives equal weight to the per-capita emissions of the populations of the past and the present day.
The results are shown in the figure below, again listing the top 10 emitters and five selected others.
Notably, the Netherlands is the top emitter on both per-capita metrics. Similarly, the UK, US and Canada all remain in the top five on this second per-capita basis.
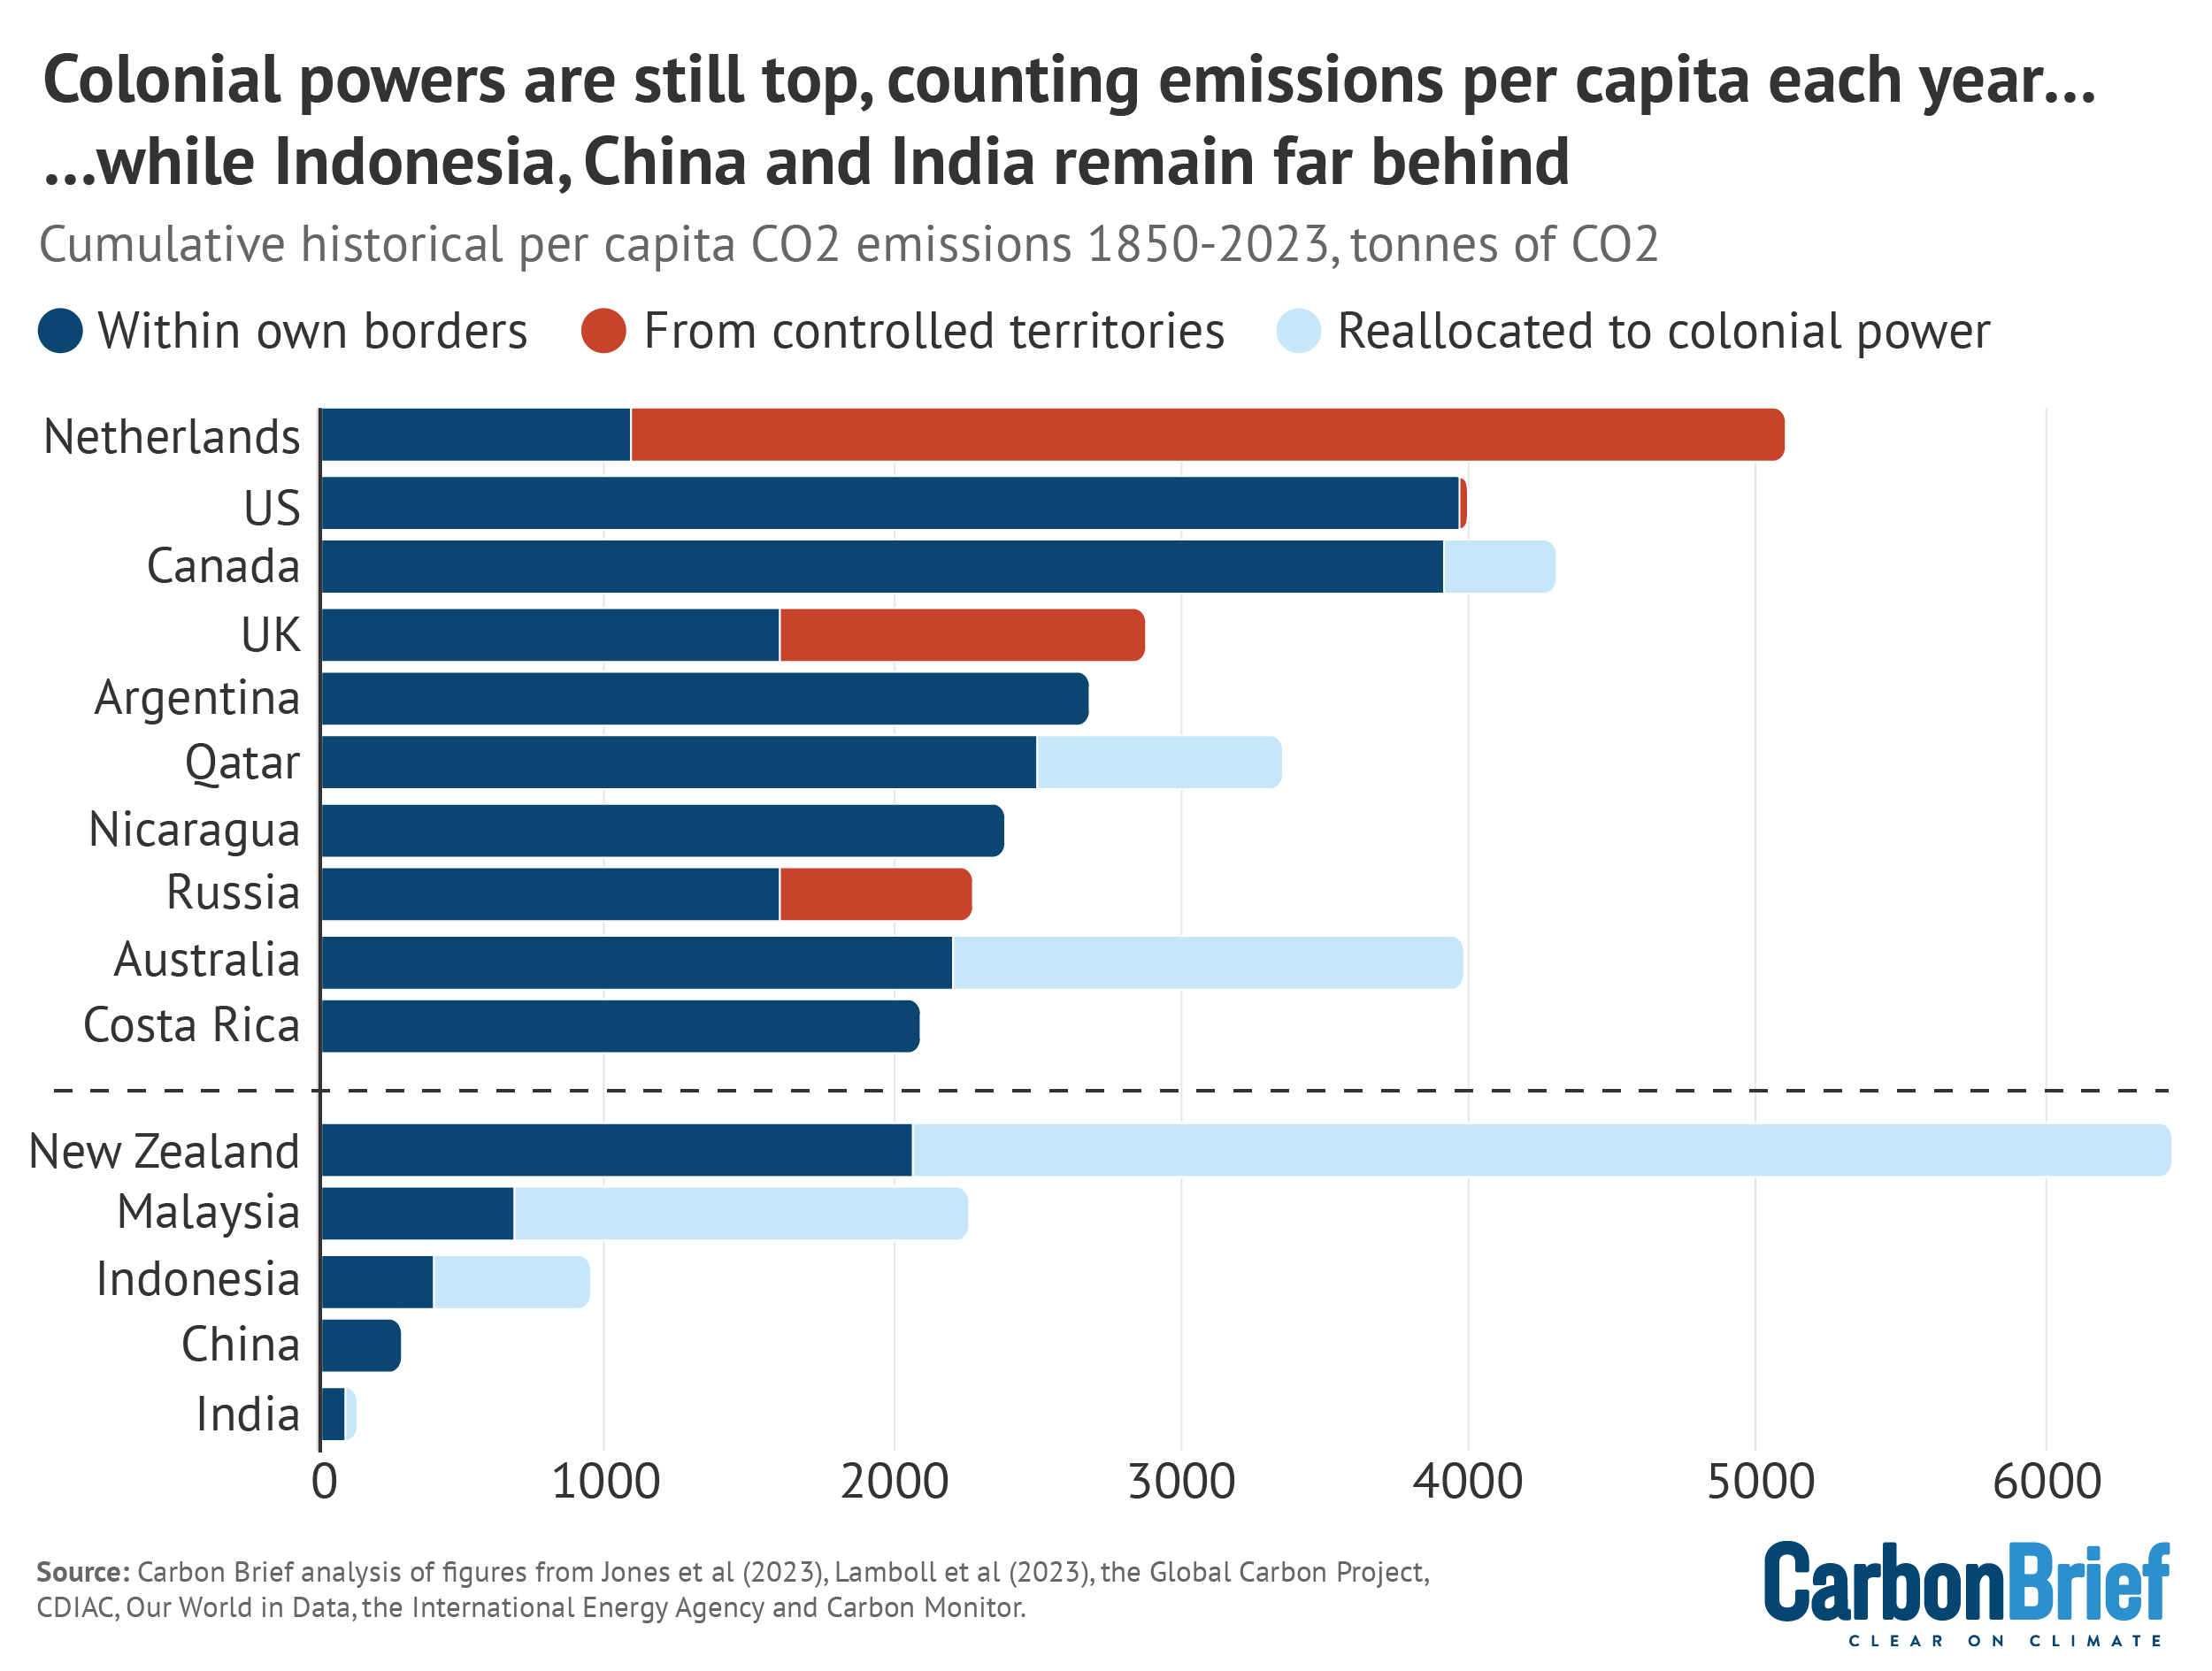
Other notable entries in the figure above include New Zealand and Australia, which ranked first and third, respectively, in Carbon Brief’s previous analysis.
Once their significant early per-capita emissions, due to deforestation under colonial rule, are taken into account, both nations drop down the rankings on this second per-capita basis.
The chart includes five other selected countries, including Malaysia and Indonesia, which illustrate similar dynamics to New Zealand and Australia. Finally, the chart once again includes China and India, showing their cumulative per-capita emissions are far behind those of most others.
How emissions imports and exports affect responsibility for warming
The search for overseas natural resources, to fuel the rise of industrialisation and globalisation, was one driver of colonial conquest.
In the post-colonial era, international trade continues to drive imports and exports of CO2, embedded in carbon-intensive goods and services.
Whereas standard emissions accounting is based on where CO2 is emitted, consumption-based emissions accounting gives full responsibility to those that use the products and services rendered with fossil energy. This tends to reduce the total for major exporters, such as China.
However, there are challenges to calculating emissions on this basis, as it requires detailed trade tables. The consumption emissions data used for this analysis only begins in 1990 and only includes CO2 from fossil fuels and cement, meaning it excludes pre-1990 trade and LULUCF.
With these limitations in mind, the figure below shows how national responsibility for historical emissions is shifted further, when accounting for CO2 traded in goods and services.
Cumulative emissions in the period 1850-2023, including those that took place overseas under colonial rule, are shown in dark blue. The red chunks show additional CO2 associated with imported goods and services since 1990, while light blue shows CO2 embedded in exports.
Notably, former colonial powers, the UK and France have also been net CO2 importers since 1990, as the chart shows – although the impact on their overall totals is small.
When including these CO2 imports and exports, the UK’s share of historical emissions rises from 5.1% to 5.3%, while France goes from 2.2% to 2.3%.
On the flip side, China’s share of historical emissions and responsibility for current warming falls from 12.1% to 11.1%, when accounting for the trade in embedded CO2 since 1990. India’s share of the global total also falls, albeit fractionally, from 2.9% to 2.8%.
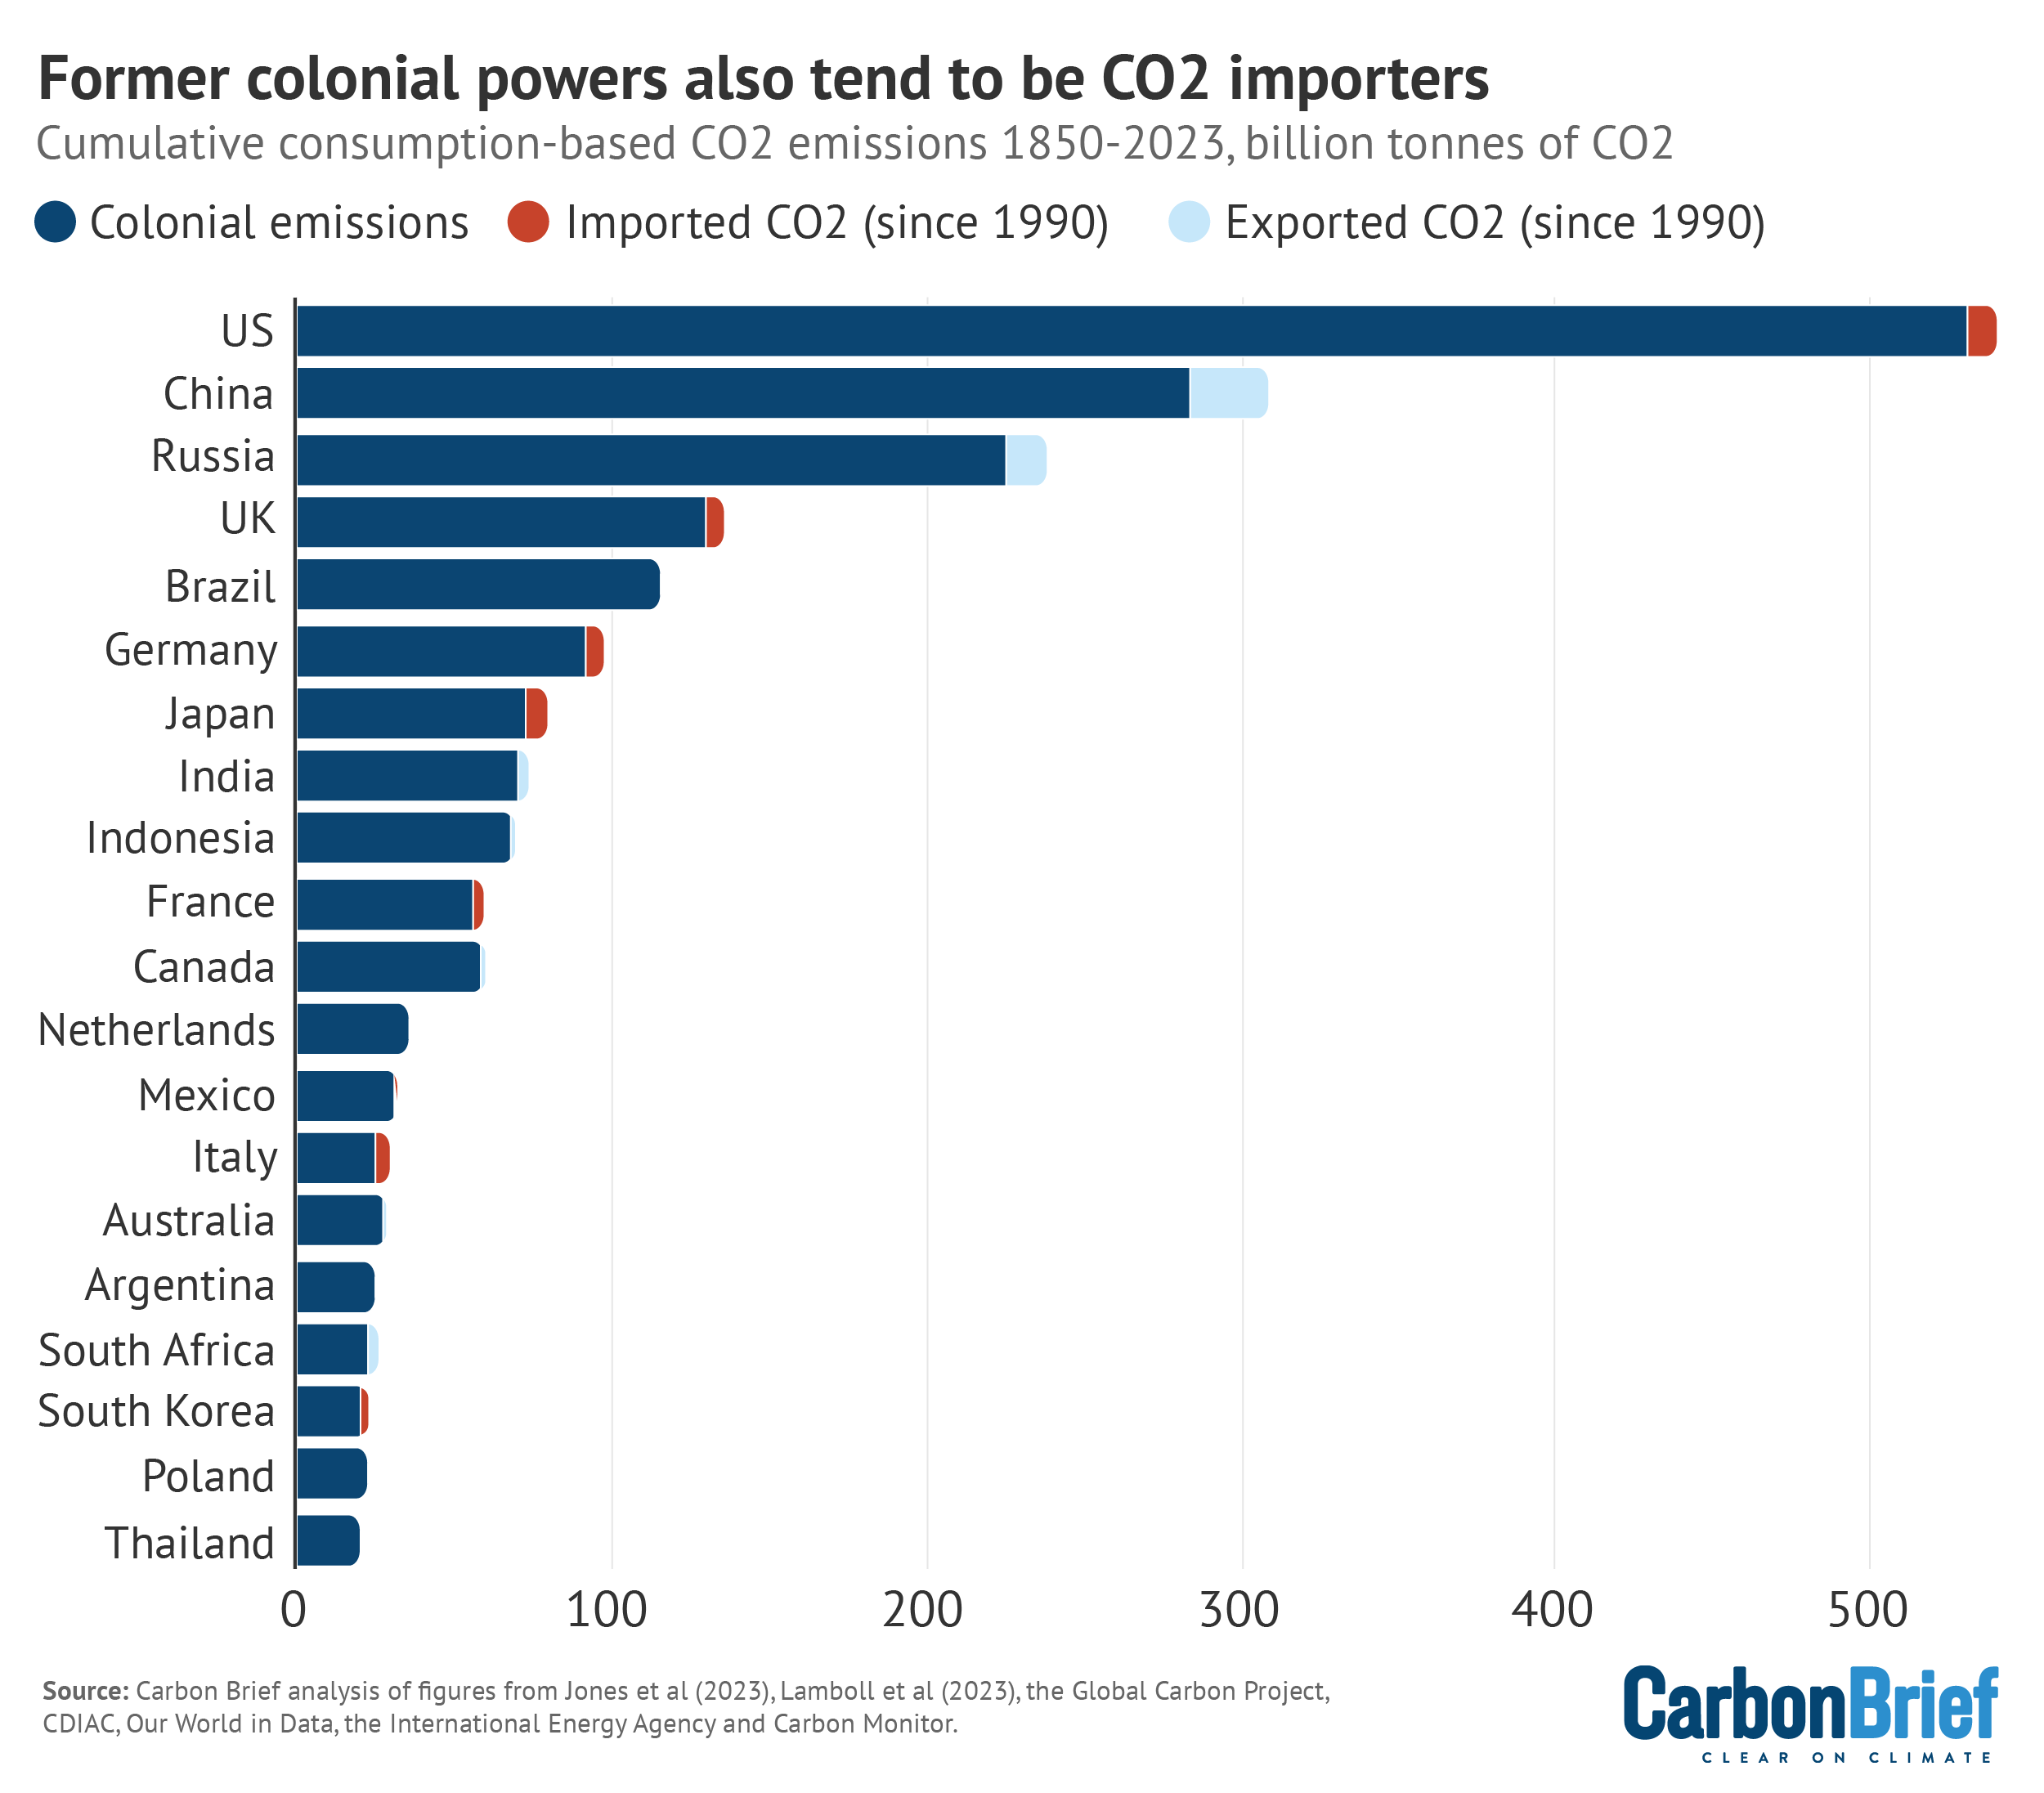
Exported goods accounted for as much as a quarter of China’s annual emissions in the mid-2000s. More recently, however, their share is down to around 10% of China’s yearly CO2 output.
Including carbon-intensive trade prior to 1990 would shift the picture shown in the figure above.
The UK, as the “workshop of the world” in the 19th century, exported large volumes of energy- and carbon-intensive goods – often manufactured using resources gathered from its empire.
Other industrialising nations, such as the US and Germany, were also major exporters of manufactured goods, playing, as one 2017 paper puts it, a similar role to that of China today.
Table: Historical emissions and colonial responsibility
This article highlights the many alternative lenses through which historical responsibility can be viewed, with each showing a slightly different viewpoint on the world.
In order to foster discussion and debate over the figures – and in the spirit of transparency – the table below shows a range of metrics for all countries in 2023.
The table, which is sortable and searchable, lists countries according to their population, historical emissions within their own borders, emissions after accounting for colonial responsibility and the impact of CO2 embedded in trade since 1990 combined with colonial emissions.
Finally, the table shows the two alternative per-capita metrics. The first shows cumulative colonial emissions for each country, weighted by its population in 2023. The second shows per-capita colonial emissions in each year, cumulatively added up through to the present day.
(Note that as for the figures above, this table excludes countries with a population of less than 1 million people.)
This data is free to use under the terms of Carbon Brief’s CC licence. The licence applies to non-commercial use and requires a credit to “Carbon Brief” and a link to this article.
A complete dataset covering all countries and all years, including the split between fossil fuel and LULUCF emissions, is available via GitHub, under the same licence conditions.
Methodology: Historical emissions and colonial responsibility
This analysis is based on historical CO2 emissions from fossil fuel use, cement production, land use, land use change and forestry (LULUCF), during the period 1850-2023.
The approach taken for this article mirrors the methodology for Carbon Brief’s 2021 analysis of historical responsibility for climate change.
That earlier article explains how it is possible to make reliable estimates of historical emissions, even though they were not monitored or recorded at the time.
In broad terms, historical fossil fuel CO2 estimates rely on records of fossil fuel production and sale, with each unit of coal, oil and gas that is burned, releasing a predictable amount of CO2.
Estimates for LULUCF are based on records of changing patterns of land use, combined with models that translate these changes into related CO2 impacts.
The historical CO2 emissions figures used in this article are taken from research published in the journal Scientific Data in March 2023, covering the years 1850-2021.
This was authored by Dr Matthew Jones, research fellow at the Tyndall Centre for Climate Change Research at the University of East Anglia, with colleagues in Norway, Austria, Germany and the US.
In turn, this draws on data for fossil fuels and cement from the Global Carbon Budget (GCB), which adapts data from the Carbon Dioxide Information and Analysis Center (CDIAC) prior to 1990.
The Jones et al paper uses estimated historical LULUCF emissions taken from three separate “bookkeeping models” that contribute to the GCB.
Emissions from fossil fuels and cement are estimated for the years 2022 and 2023 based on the percentage changes reported by Carbon Monitor, using country-specific figures where available.
Emissions from LULUCF for 2022 and 2023 are assumed to remain at 2021 levels.
Historical emissions estimates are combined with data on foreign rule, taken from a 2010 paper published in the American Sociological Review by Prof Andreas Wimmer and Yuval Feinstein, both then at the department of sociology at the University of California, Los Angeles.
Their paper tracks the rise of the independent nation state from 1816-2001. For each country and year, it lists whether a nation was independent and, if not, the foreign ruler.
Gaps in the Wimmer and Feinstein database were filled where necessary, using publicly available information. For example, the database combines some smaller colonial powers under a catch-all category of “other empires” and this was disaggregated where possible.
Notably, the database does not reflect changes in rule due to military occupation and Carbon Brief’s analysis did not attempt to update this.
Similarly, a number of countries are not included in the Wimmer and Feinstein database.
For 10 missing countries with cumulative emissions of 0.5GtCO2 (0.02% of the global total) or more, Carbon Brief added publicly available information on periods of colonial rule, for use in the overall analysis. Missing countries with cumulative emissions below 0.5GtCO2 were not added into the database, except for two countries of the former Yugoslavia that were not originally included.
The code used for this analysis – and the resulting emissions figures – is available on GitHub.
This data and code is free to use under the terms of Carbon Brief’s CC licence. The licence applies to non-commercial use and requires a credit to “Carbon Brief” and a link to this article.
A complete dataset covering all countries and all years, including the split between fossil fuel and LULUCF emissions, is available via the GitHub link, under the same licence conditions.
Methodology: Why this analysis starts in 1850
The analysis for this article covers the period 1850-2023. There are a number of reasons for choosing this time period.
First and foremost, the data prior to 1850 is incomplete, posing a practical barrier to extending the analysis further back in time. While figures are available from 1750 onwards for national CO2 emissions from fossil fuels and LULUCF, the fossil fuel figures in particular are relatively sparse.
More importantly, the Wimmer and Feinstein database on foreign rule only begins in 1816. Extending this data backwards would require manual checking for each country, as well as making judgements on the often-contested and cloudy question of when colonial rule began.
As for CO2 emitted in the 1850s, pre-1850 emissions were predominantly from LULUCF.
This is because, as noted in Carbon Brief’s 2021 analysis, CO2 emissions from fossil fuels and cement were negligible in the period before 1850. Fossil CO2 emissions during 1750-1850 amounted to less than 4GtCO2, just over 0.1% of the cumulative total emitted subsequently.
The picture is a little different for LULUCF. Figures from OSCAR, one of the three bookkeeping models used for post-1850 LULUCF estimates, extend back as far as 1701.
These figures show that some 93GtCO2 was released globally, during 1750-1850, equivalent to nearly 4% of the cumulative total from all sources during 1850-2023.
Nearly a quarter of this total originates in China and would not be reassigned on the basis of colonial rule. Another fifth is from the US and an eighth from Russia, but only just over 10% of the US figure occurred under British rule before 1776.
More notably, in the context of assigning colonial responsibility for historical emissions, are 4GtCO2 from LULUCF in India and the same again in Indonesia. Both countries were already under significant colonial influence, even if not outright direct rule.
Nevertheless, there is another reason to begin this analysis only in 1850. Specifically, 1850 is usually taken as the reference year for historical simulations and marks the starting point for temperature changes, which are generally measured against an 1850-1900 baseline.
The IPCC’s sixth assessment report calculates the “remaining carbon budget” for staying below 1.5C – or any other given temperature – starting from 1850.
This is because there is no good temperature baseline before then, says Prof Pierre Friedlingstein, chair in mathematical modelling of climate systems at the University of Exeter.
This article was written by Simon Evans and edited by Leo Hickman. Data analysis was carried out by Verner Viisainen. Visuals by Tom Pearson and Tom Prater.
-
Revealed: How colonial rule radically shifts historical responsibility for climate change


