Revealed: Colonial rule nearly doubles UK’s historical contribution to climate change
Multiple Authors
11.27.23Multiple Authors
27.11.2023 | 8:00amThe UK is responsible for nearly twice as much global warming as previously thought, due to its colonial history, Carbon Brief analysis shows.
History matters because the cumulative amount of carbon dioxide (CO2) emitted since the start of the industrial revolution is closely tied to the record temperatures expected in 2023.
Previous analysis had put the UK’s share of cumulative historical emissions at 3.0% of the global total, including CO2 from fossil fuels, cement, land use, land use change and forestry (LULUCF).
This made the UK the eighth largest contributor to current warming, behind the US (1), China (2), Russia (3), Brazil (4), Germany (5), Indonesia (6) and its former colony India (7).
According to Carbon Brief’s new analysis, however, the UK is responsible for nearly twice as much warming as previously thought – some 5.1% of the global total – due to its colonial history.
This bumps the UK up to fourth place in terms of its historical responsibility for climate change, still behind the US, China and Russia – but now ahead of India, Brazil and Germany.
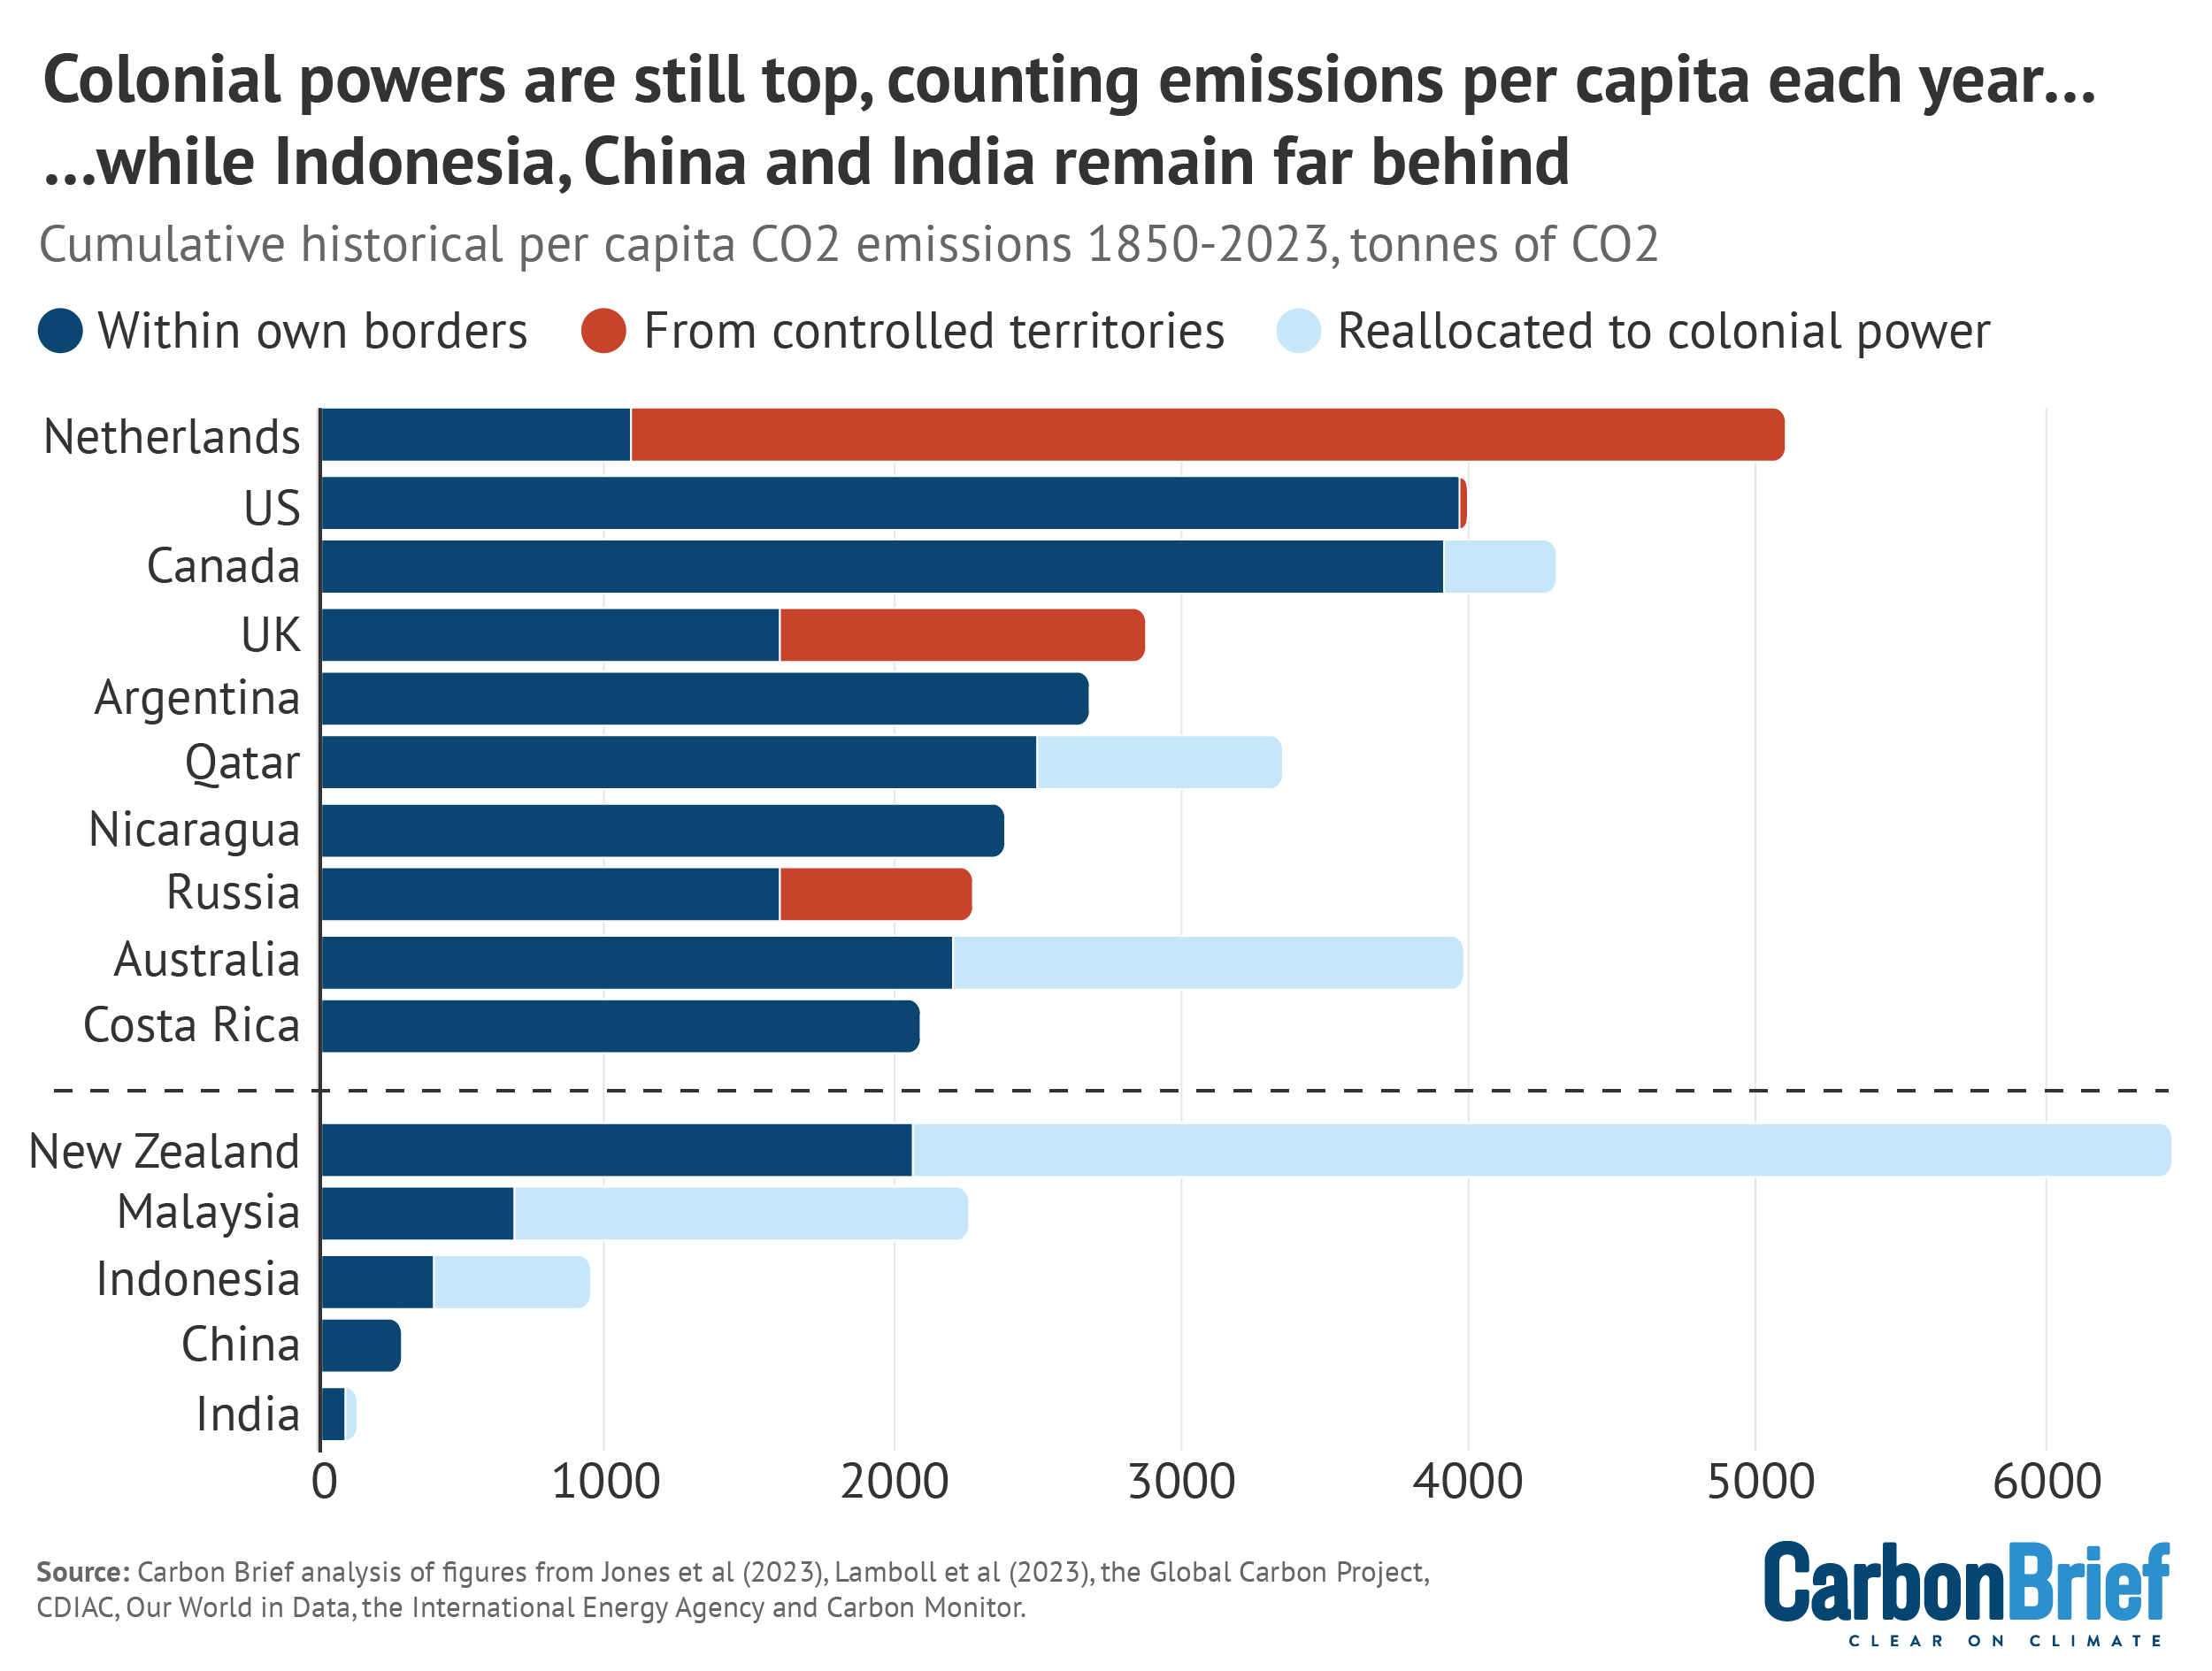
Moreover, the UK’s population are the second-highest emitters on a per-capita basis, when accounting for emissions under colonial rule.
For full details on the methods and data used in the analysis for this piece, as well as information on other countries, see the detailed companion article.
Historical emissions
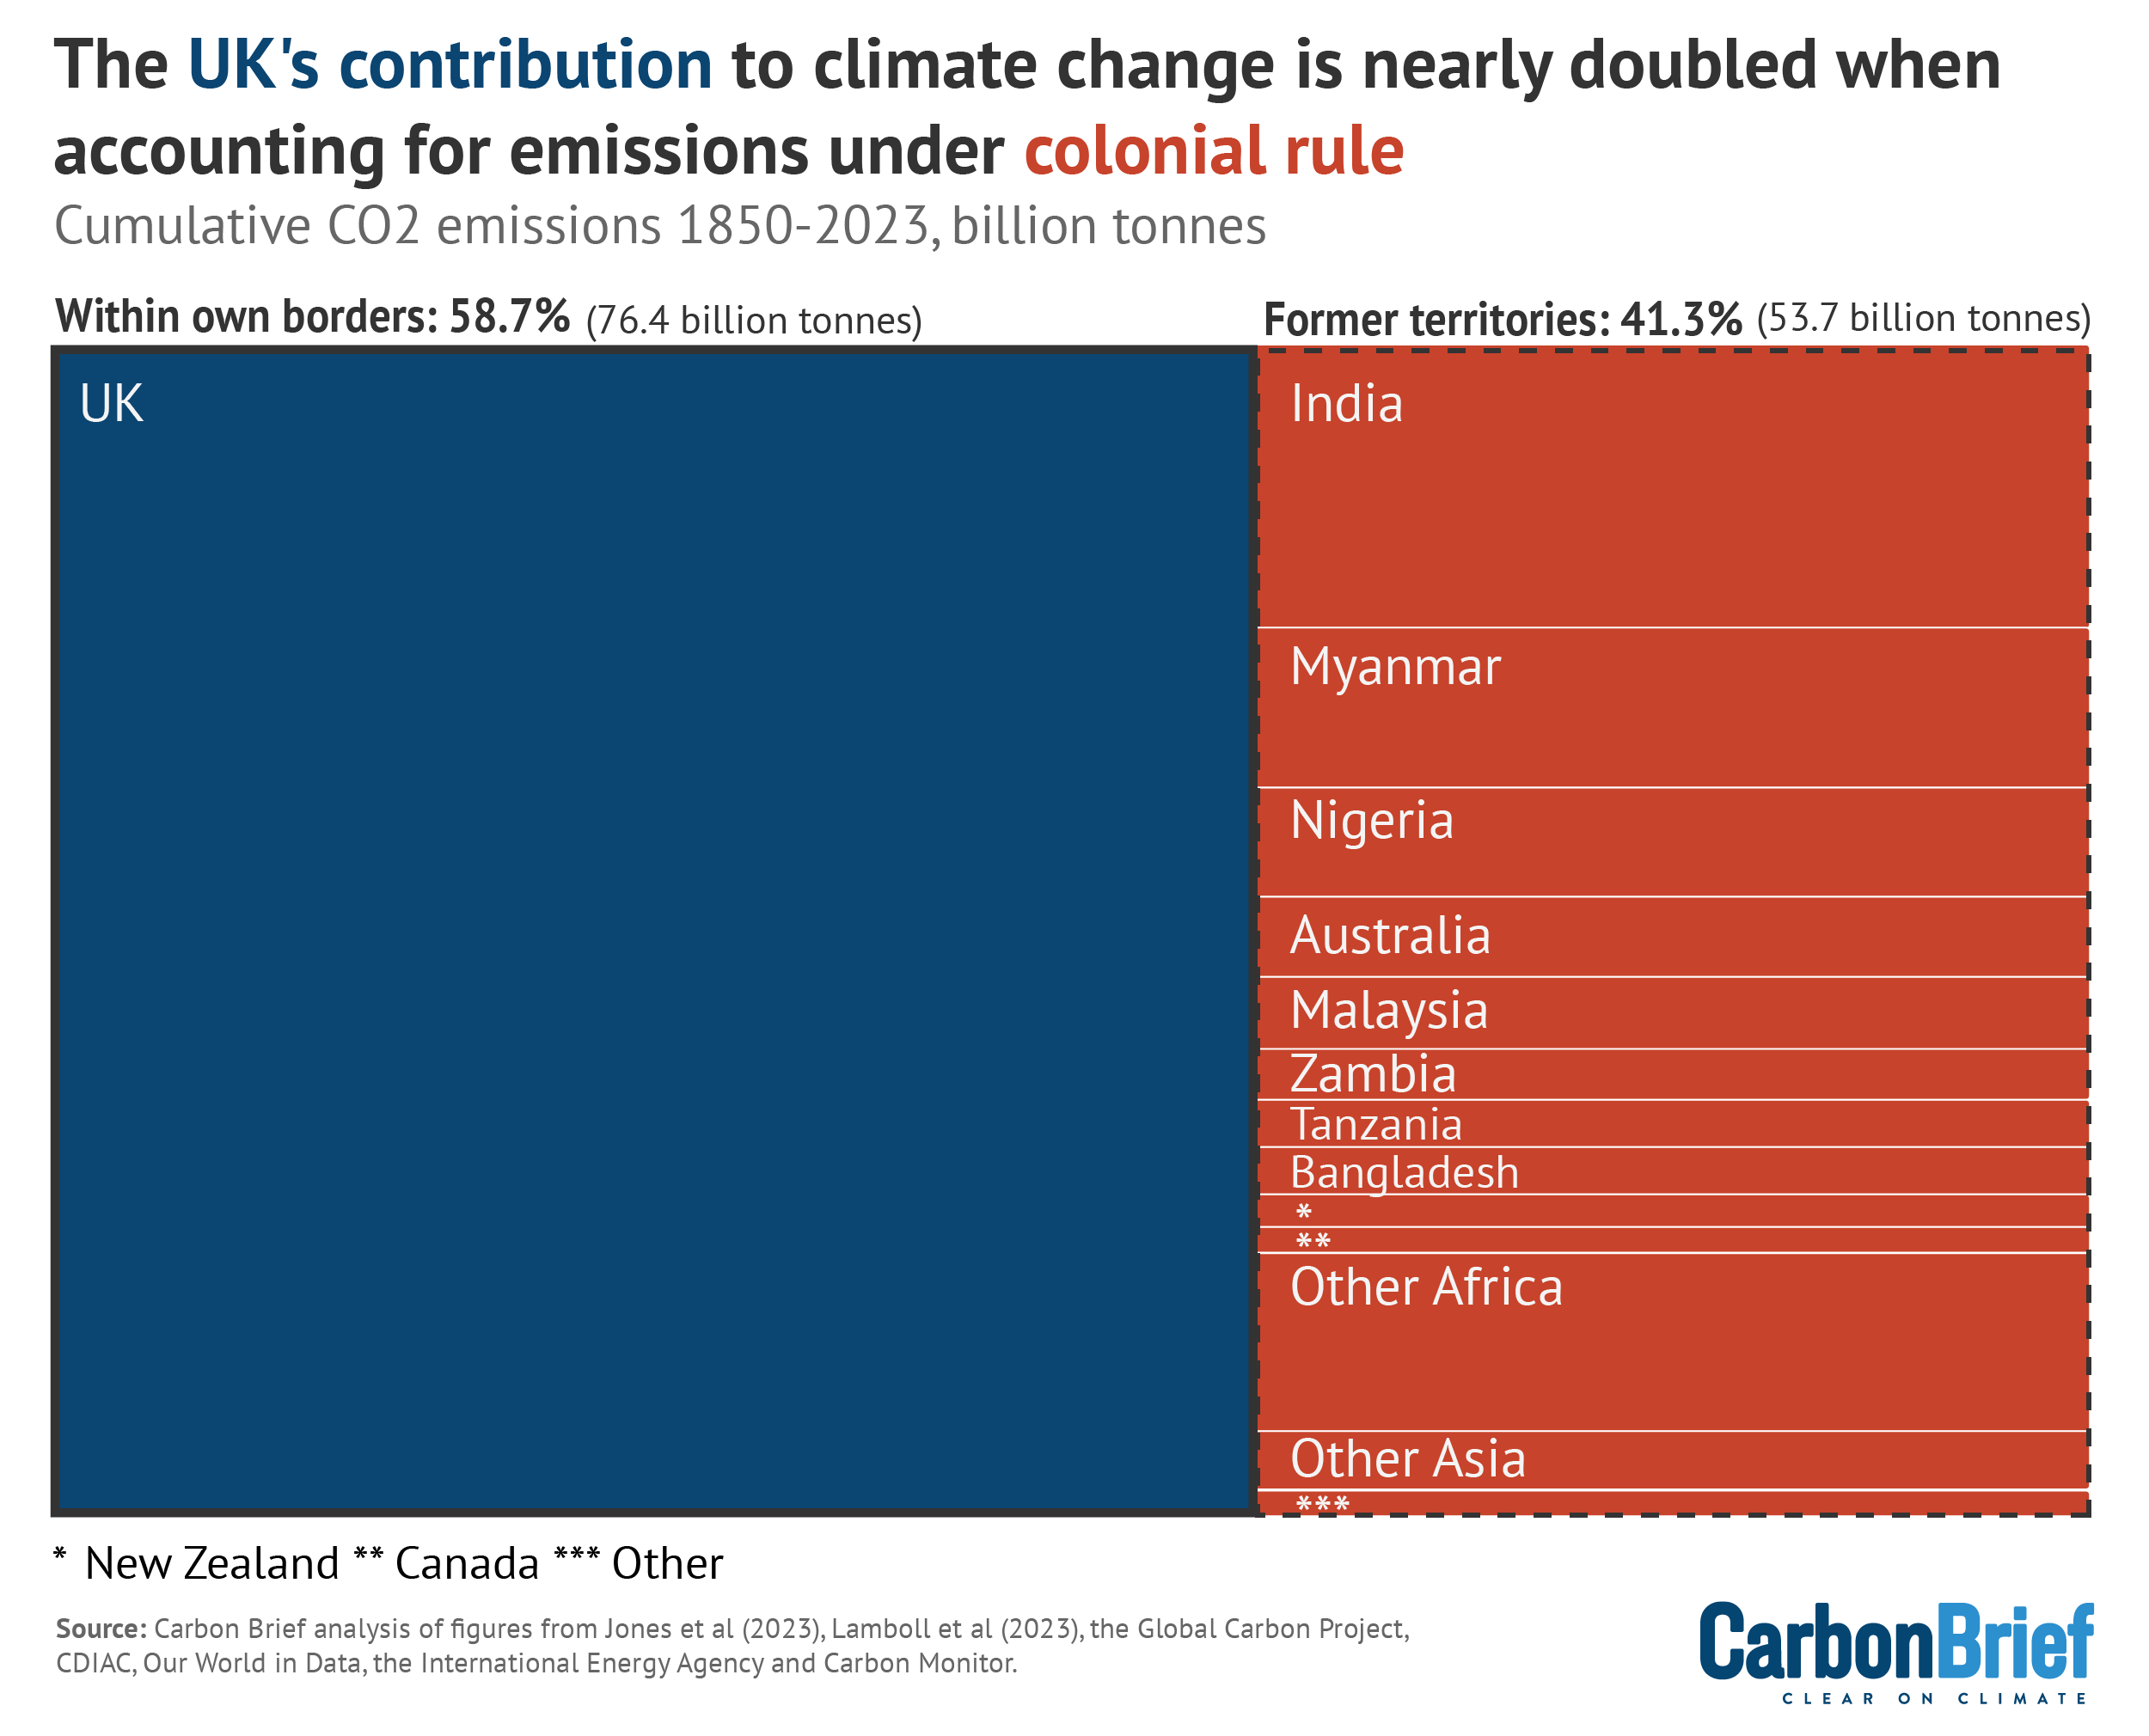
Looking at emissions taking place within the borders of the UK alone, the country released some 76.4bn tonnes of CO2 (GtCO2) between 1850-2023.
This amounts to some 3.0% of global cumulative emissions over the same period, including CO2 from fossil fuel use, cement production and LULUCF, the world’s eighth highest share.
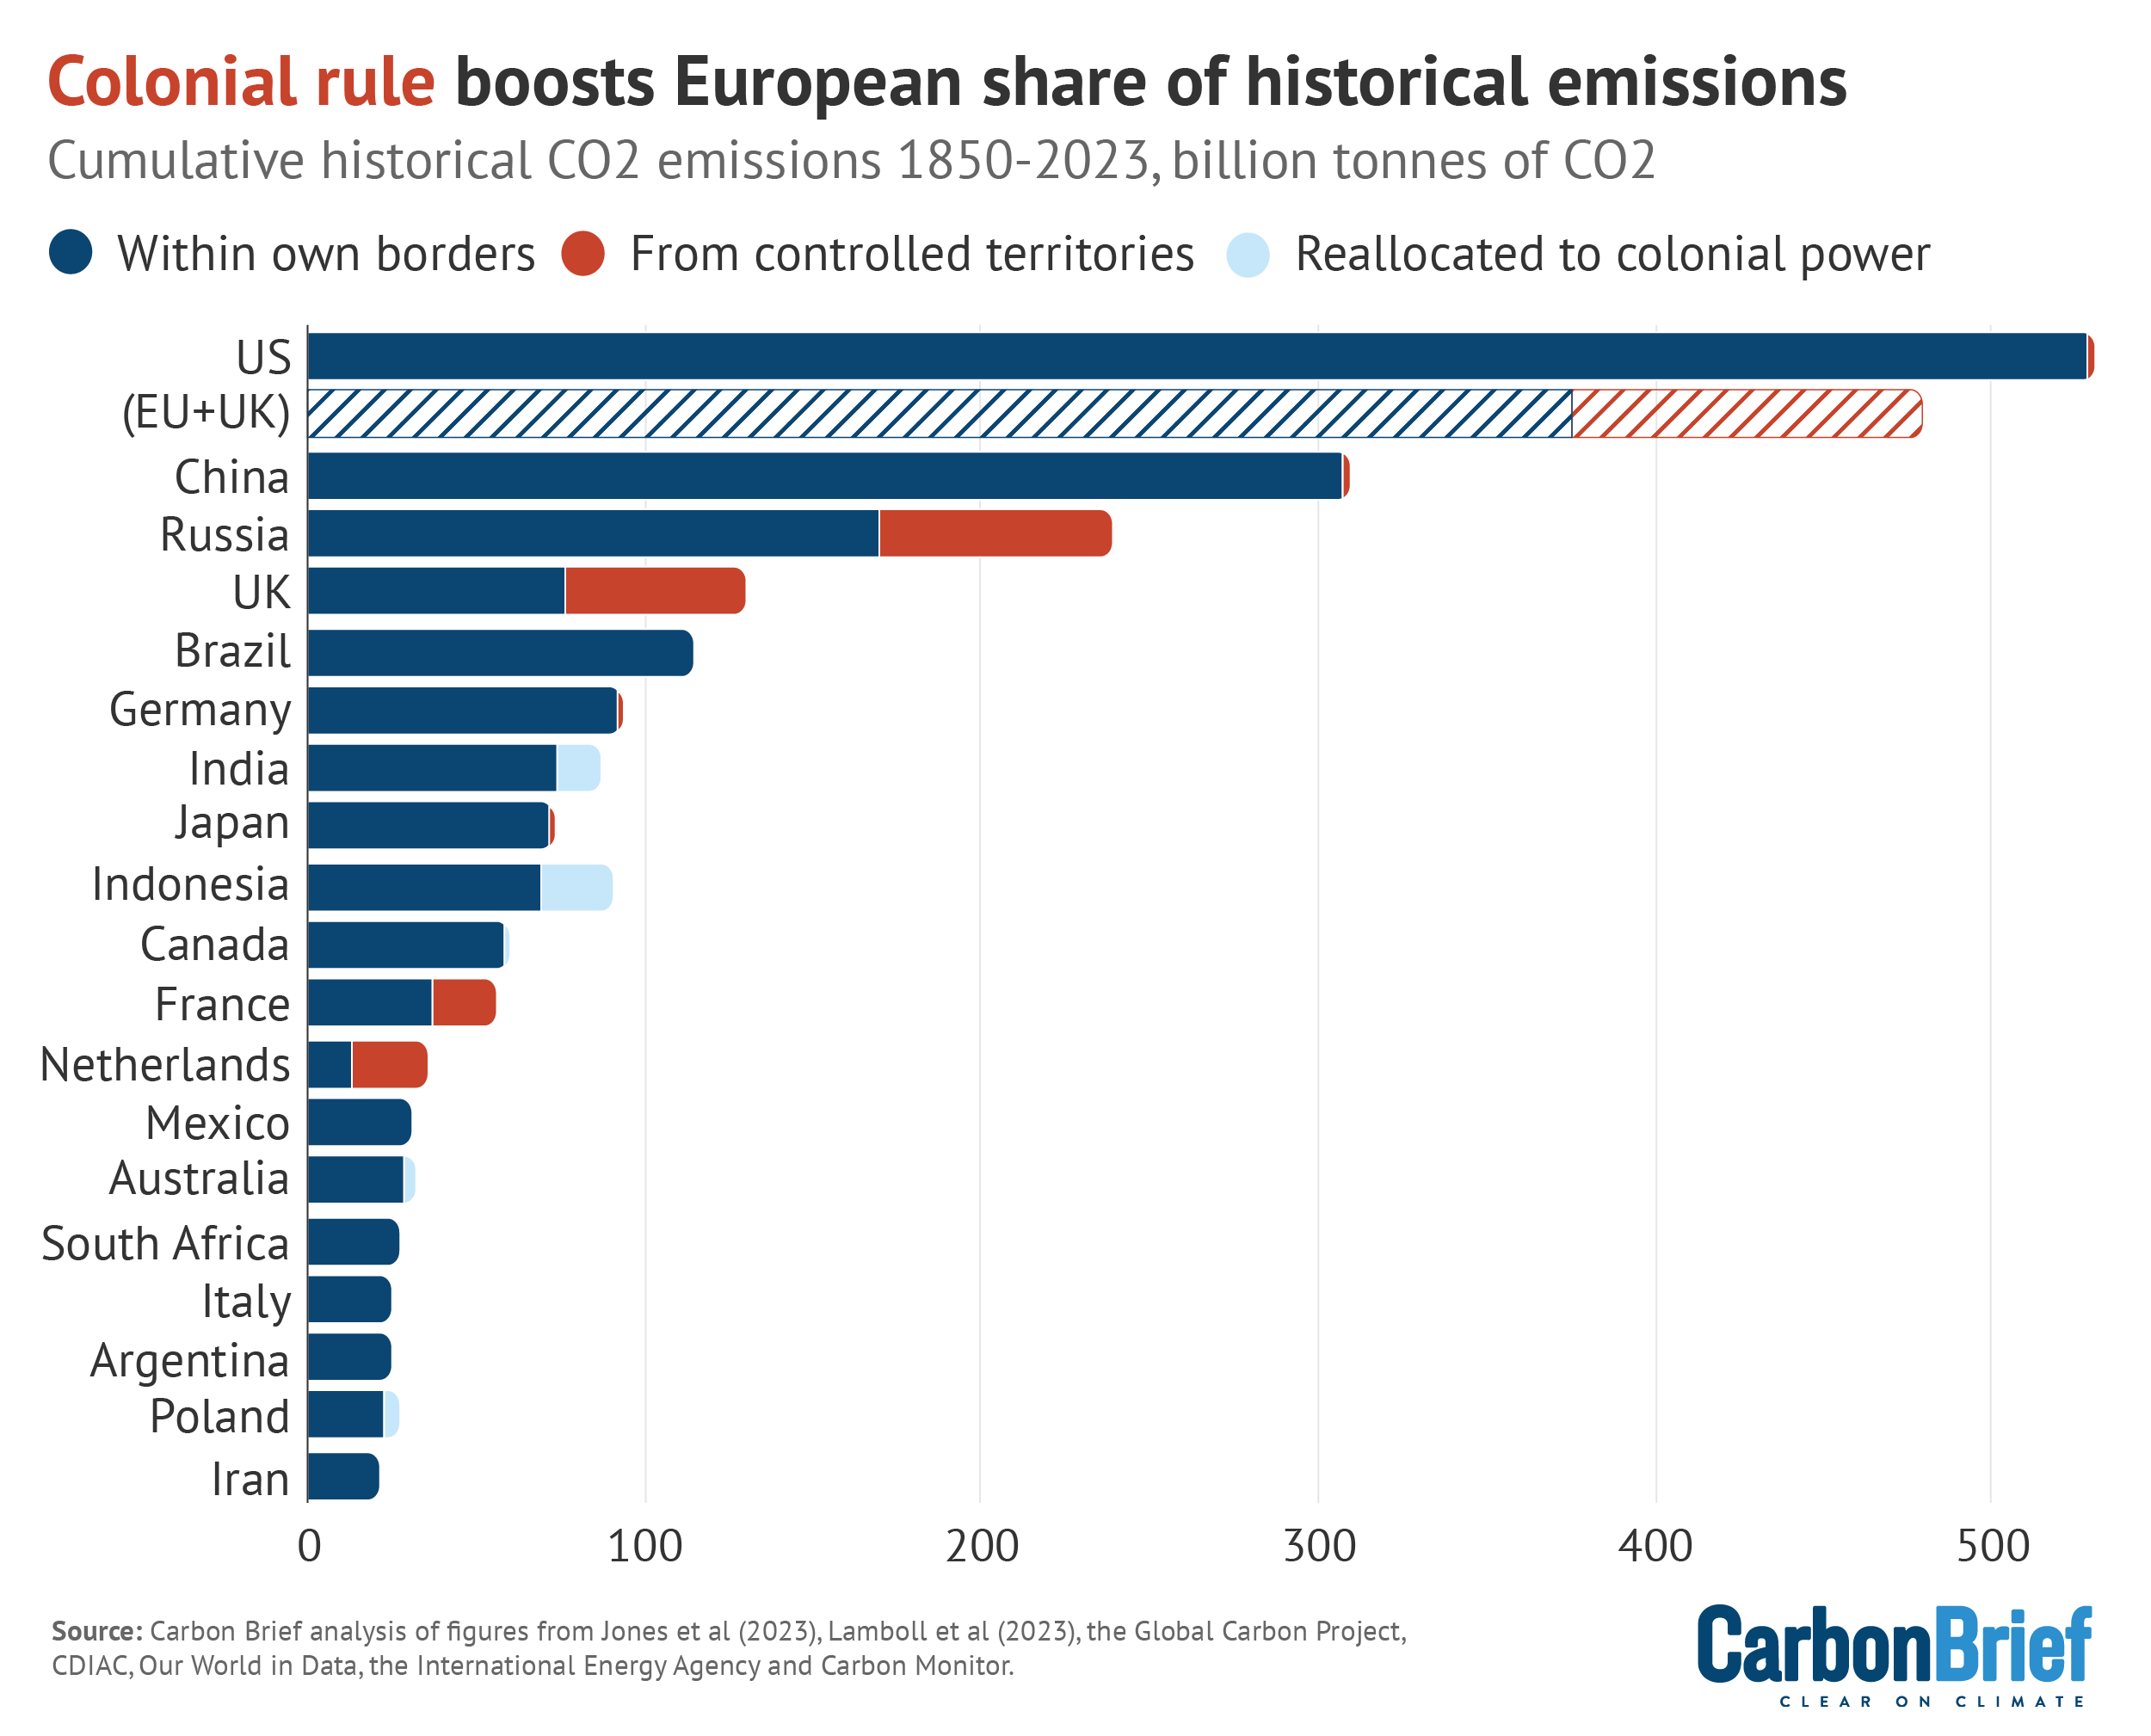
After adding emissions outside the UK, but under its colonial rule, its emissions rise to 130.2GtCO2, the fourth highest contribution and accounting for 5.1% of the global total.
This is shown in the figure below, which illustrates the significance of these colonial emissions for the UK, as well as for other former imperial powers Russia, France and the Netherlands.

Other former imperial powers, such as the Netherlands and France, see similarly dramatic jumps in their historical responsibility for warming. The Netherlands rises from 35th to 12th in the rankings, with its cumulative emissions nearly tripling, while the French total rises by 50%.
As a group, the EU+UK is the world’s second-largest historical contributor to warming after the US, with or without colonial emissions. Adding emissions under colonial rule increases its cumulative contribution by 28% and its share of the global total by 4 percentage points, from 14.7% to 18.7%.
Colonial emissions
The largest contributor to the UK’s colonial emissions is from India, which was under British rule from the start of the period of this analysis, 1850, until it achieved independence in 1947.
This is shown in the figure below, with territorial emissions within the UK shown on the left and colonial emissions in countries that were part of its empire on the right.

India adds 13.0GtCO2 to the UK total, of which 11.2GtCO2 (86%) is due to land use, land use change and forestry – in other words, mainly due to deforestation.
Other significant contributors include Myanmar (7.3GtCO2), Nigeria (5.1GtCO2), Australia (3.6GtOC2) and Malaysia (3.3GtCO2). Again, almost all of this CO2 came from deforestation.
Per-capita emissions
The impact of emissions under colonial rule also has a major impact when weighted on a per-capita basis, using the current population of the UK.
Cumulative emissions within UK borders 1850-2023 amount to 1,128tCO2 per capita, the seventh highest figure among countries with a population of at least 1 million people.
However, the UK’s current population are each responsible for 1,922tCO2 over 1850-2023 – the world’s second highest figure – when including emissions overseas under its colonial rule.

This article was written by Simon Evans and edited by Leo Hickman. Data analysis was carried out by Verner Viisainen. Visuals by Tom Pearson and Tom Prater.
-
Revealed: Colonial rule nearly doubles UK’s historical contribution to climate change


