Q&A: Why methane levels are rising with no ‘hint of a decline’
Multiple Authors
09.10.24Multiple Authors
10.09.2024 | 4:56pmLevels of methane in the atmosphere have soared by record-breaking amounts since 2020, according to new research.
Methane is a potent greenhouse gas that locks in around 80 times more warming over the course of two decades than CO2, but fades more quickly from the atmosphere.
As a result, cutting methane emissions is widely viewed as a crucial part of near-term efforts to tackle climate change.
The gas is emitted by both natural and human-caused sources, particularly wetlands, agriculture and the extraction and use of fossil fuels.
Two-thirds of methane emissions now come from human activities, according to the latest update to the Global Methane Budget, an international collaboration that estimates sources and sinks of methane around the world.
Methane levels show no “hint of a decline”, and the continued rise is “incompatible” with climate goals, the lead study author tells Carbon Brief.
In this Q&A, Carbon Brief unpacks how atmospheric methane has soared in recent years, how countries have promised to slash emissions and the main methane-emitting sectors.
- What role does methane play in climate change?
- Why is cutting methane a ‘quick win’ for limiting global warming?
- How have countries promised to cut methane?
- What are the biggest sources of methane emissions?
What role does methane play in climate change?
Methane is the second-largest contributor to global warming, after carbon dioxide (CO2). It accounts for 0.5C of the warming since pre-industrial times, compared to 0.8C for CO2.
Methane has a stronger warming effect than CO2, as it traps more heat in the atmosphere, but it remains in the atmosphere for a much shorter period of time.
Over the course of two decades, the “global warming potential” of methane is more than 80 times greater than CO2, and over a 100-year period, it is around 30 times more potent.
The latest Global Methane Budget, detailed in an Environmental Research Letters paper, finds that emissions reached an estimated 575m tonnes each year over 2010-19. The biggest chunk of these emissions came from wetlands, inland freshwaters, agriculture, waste and fossil fuels.
Global average methane concentrations in the atmosphere reached 1,931 parts per billion as of January this year. The previous budget, published in 2020, reported levels at 1,875 parts per billion.
(The team of researchers will release their detailed datasets in Earth Systems Science Data, but the research is currently available as a pre-print.)
Recent years have seen the second (2020), first (2021), fourth (2022) and 14th (2023) largest increases in global methane concentrations since the US National Oceanic and Atmospheric Administration (NOAA) began recording this data in 1983.
Prof Rob Jackson, a professor in Earth system science at Stanford University and lead author of the Environmental Research Letters paper, tells Carbon Brief he was “surprised and disappointed” by the extent of the ongoing rise in methane concentration.
Jackson, who is also chair of the Global Carbon Project, the group behind the research, adds:
“Methane levels are not just increasing, they’re increasing faster than they were [in the past]…[I]t’s incompatible with not just 1.5C, but 2C – and has us heading towards 3C if it continues.”
The graphic below highlights the sources and sinks of methane in 2020. It shows that more than 600m tonnes of methane were emitted globally that year.

The research finds that around two-thirds of global methane emissions come from human activities. Within this, 40% comes from agriculture, 34% from fossil fuels and 19% from waste. The remainder comes from biomass and biofuel burning.
China, the US, India, Russia and Brazil have the highest human-caused methane emissions, according to the International Energy Agency (IEA).
The other one-third of methane emissions come from natural sources, particularly wetlands, such as bogs and salt marshes.
Globally, methane levels in the atmosphere have been rising steadily in recent decades, but scientists have noticed a particular surge since 2007, shown in the chart below.

Recent studies showing an exceptional growth in methane emissions from wetlands may partially explain the rise, which has left some experts baffled. Jackson tells Carbon Brief:
“There’s something happening in the tropics, and there’s a lot of concern that increased tropical emissions may be something of a tipping point for methane. If tropical emissions begin to increase from natural wetlands, we have no way to mitigate those emissions.”
As this Global Methane Budget mostly focuses on data over 2010-20, Jackson says the next budget will look at data on the wetland surge in greater detail. He adds:
“I think there’s enough evidence to say that natural systems are contributing to the increase in recent years, but I don’t think we could attribute all that increase to natural systems.”
Other factors could also help explain the surge, including a continued increase in both agricultural and fossil fuel methane. Additionally, climate change may be causing methane sinks to decline and methane to break down in the atmosphere more slowly.

The new research uses a pair of approaches to estimate methane emissions and sinks.
Jackson says the mix of approaches – “top-down” and “bottom-up” – offers “different insights” into methane increases on a global and sectoral scale.
The “bottom-up” approach focuses on methane emissions at source. It uses data on human-caused emissions that are submitted by individual countries in national greenhouse gas inventories to the UN and models estimating land emissions.
The “top-down” approach, on the other hand, starts from observations of global methane concentrations and works backwards using model simulations to estimate where they originated.
The latest budget also examines the distinction between categorising methane emissions as human-caused or natural.
For example, the researchers estimate that 30m tonnes of methane emissions per year come from human-made reservoirs behind dams. Jackson points out that these emissions could be considered human-caused “as much…as emissions from a landfill or a coal mine”.
But Jackson says these calculation changes did not factor into the estimate that two-thirds of methane emissions are now human-caused. These stem from “the traditional sources that we measure”, such as fossil fuels and agriculture, he says.
The main takeaway from the latest budget, Jackson notes, is “just how far we are from where we need to be”:
“[Global] temperature thresholds include CO2 and nitrous oxide and methane together, but when you look at the contribution to warming from methane and the temperature targets, we are miles from where we should be.”
Why is cutting methane a ‘quick win’ for limiting global warming?
Keeping the global temperature rise “well below” 2C and aiming to limit it to 1.5C is the long-term goal of the Paris Agreement.
Research shows that passing 1.5C above pre-industrial temperatures would compound risks – including the possibility of crossing multiple important tipping points in the Earth system.
A recent study found that every increment of global warming above 1.5C increases the risk of breaching these critical thresholds, which could, for example, shift swathes of lush Amazon rainforest into dry savannah.
Due to its short lifetime in the atmosphere and potent warming potential, the Intergovernmental Panel on Climate Change (IPCC) has said that “strong, rapid and sustained reductions” in methane would limit warming and also improve air quality.
(Methane adds to dangerous air pollution by helping to form ground-level ozone, which can lead to premature deaths and ecosystem impacts.)
Cutting methane by 30% by 2030 is the “fastest way to reduce near-term warming” and keep 1.5C “within reach”, according to a factsheet from the US and EU. (See: How have countries promised to cut methane?)
More than 150 countries have signed a Global Methane Pledge to slash emissions by 30% by 2030, compared to 2020 levels. The overarching pledge, announced in 2021, does not indicate a specific contribution each country or sector has to make.
Current projections show methane levels dropping in the coming decades. The chart below from the synthesis of the IPCC’s most recent assessment report shows the projections for future methane emissions under three modelled climate pathways: one that limits warming to 1.5C (blue), one that limits warming to 2C (green) and one that represents currently implemented policies (red).

Prof Grant Allen, professor of Earth and environmental sciences at the University of Manchester, says that all greenhouse gases need to be urgently reduced to limit future climate change, but methane reductions are a particularly “quick-win”. He tells Carbon Brief:
“If you cut methane now, it can have an immediate impact because of its short half-life in the atmosphere compared to CO2. But CO2 emissions, once they’re there, they’ll continue having an effect for hundreds of years.”
Reducing methane has “long been seen as low-hanging fruit for climate policy”, a group of climate scientists wrote in a 2021 Carbon Brief guest post on the Global Methane Pledge.
According to the EU and US, delivering on the pledge “would reduce warming by at least 0.2C by 2050”. Similarly, a UN Global Methane Assessment, published in 2021, says that reducing methane emissions by 45% by 2030 would avoid almost 0.3C of warming by the 2040s.
However, the guest post authors warned that “global methane reductions of around 50% will likely be needed” to realise a 0.2C saving.
Allen says that while part of the recent methane rise stems from natural sources, “that doesn’t mean that we can’t bring methane down by cutting out” human-caused emissions as well. He tells Carbon Brief:
“Everything’s important. Some things we have some control over, and other things we really don’t. And if we’ve passed a point where the natural environment is kicking us in the ass with climate feedback, then that’s something we can’t do anything about. That’s a real worry.”
How have countries promised to cut methane?
During the COP26 climate summit in Glasgow in 2021, the US and the EU launched the Global Methane Pledge. Meeting this goal to cut methane emissions by 30% by 2030 would reduce global emissions by the equivalent of the entire global transport sector, according to the IEA.
A 2023 study explored whether countries’ existing methane-reduction plans can help achieve the pledge’s aim.
Researchers analysed the climate pledges – “Nationally Determined Contributions”, or NDCs – that countries have made under the Paris Agreement on how they will mitigate and adapt to climate change.
Of 168 NDCs – including the EU, which submits a single one on behalf of its 27 member states – 86% included methane reductions. The pledges contained 476 individual methane-mitigation actions targeted at three major methane-emitting sectors: fossil fuel production, agriculture and waste.
However, most countries did not specify quantitative targets or timelines for implementing mitigation measures.
Only a few countries, such as Japan and Nigeria, include the methane reductions they expect to reach with their NDCs. Nigeria is committed to halting gas flaring emissions by 2030, while Japan aims to reduce its methane emissions by 12% by 2030.
The maps below, taken from the 2023 study, show the countries that have set methane reduction targets within their NDC. Each row shows a sector: agriculture (top), waste management (middle) and fossil fuel production (bottom). Countries in blue have signed the Global Methane Pledge, while those in red did not join the agreement.
The most common pledges were reducing methane emissions from solid waste at landfill sites, increasing the percentage of separated and recycled solid waste and upgrading wastewater treatment plants with methane gas recovery.

The researchers found that if all 476 methane mitigation actions were fully implemented, global human-caused methane emissions would be slashed by about 31%. Therefore, they would achieve the Global Methane Pledge goal, which aims to reduce 30% of global methane emissions by 30% in 2030.
The paper also breaks down mitigation actions by sector. For instance, measures to reduce “fugitive” methane emissions leaking during oil production were included by 18% of countries.
Actions to reduce on-farm emissions from manure management and livestock were pledged by 30% of nations.
Capturing landfill gas – which is created by decomposing organic matter – was mentioned by 59% of countries.
The study concludes that to limit global warming to 1.5C, a greater ambition of methane reduction actions is needed, including individual behavioural measures – such as shifting to low methane-emitting diets and reducing organic waste generation – as well as the participation of countries that have not yet signed the pledge.
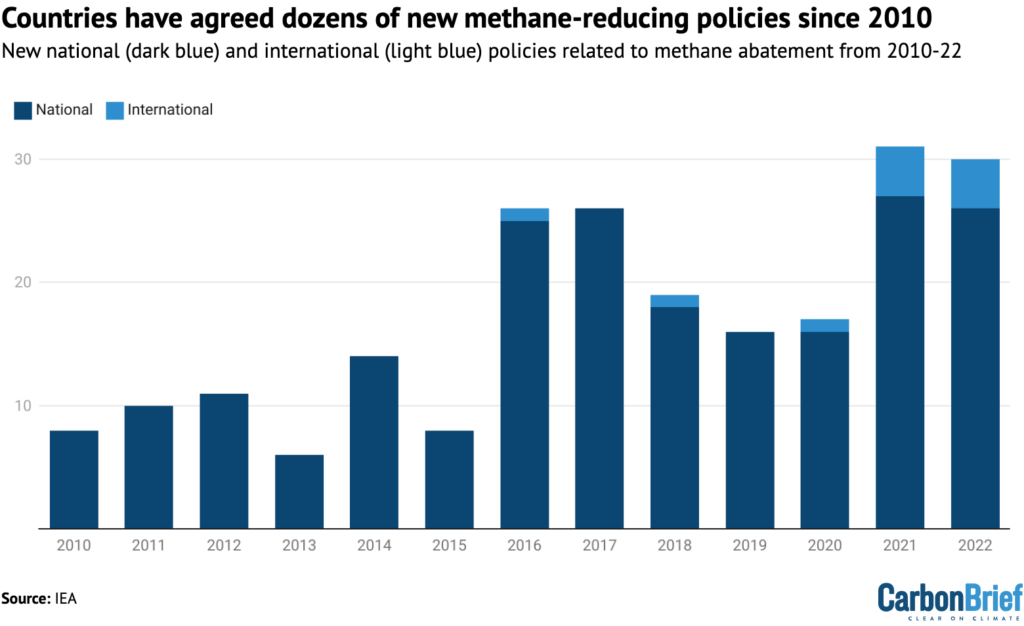
Even before the Global Methane Pledge, there had been an increase in policies and measures to reduce methane emissions.
This IEA chart of new policies since 2010 shows that most of them have been implemented at a national level (dark blue). Since 2021, there has been an uptick in international policies aimed at cutting methane (light blue).
Since the Global Methane Pledge, a number of countries have published their specific plans on reducing methane.
In 2021, the US launched its methane emissions reduction action plan to cut emissions from oil and gas production by 75% and from agriculture by 10%. In 2022, Canada announced its methane strategy to cut 35% of methane emissions by 2030, including 75% of methane emissions from oil and gas production.
Also in 2022, the EU and US, along with 11 other countries, launched the Global Methane Pledge Energy Pathway, to accelerate methane emissions reductions from the oil and gas sector.
In 2023, China issued a methane action plan, which includes 20 “key tasks” for reducing methane, such as emissions monitoring and developing policy frameworks. However, it lacks numerical targets, as Carbon Brief reported at the time.
Developing countries are also crucial to reducing methane emissions, says Dr Marcelo Mena, chief executive of the Global Methane Hub, a philanthropic organisation that supports countries in fulfilling their commitments under the Global Methane Pledge.
Mena tells Carbon Brief:
“Overall, methane mitigation has been approached from the energy sector standpoint. For countries that do not have oil and gas production, how will they lower emissions in the waste and livestock sector? There is a lot of work to be done.”
Less than 2% of global climate finance – totalling just over $10bn – was targeted at methane mitigation in 2019-20, according to an analysis by the not-for-profit research group Climate Policy Initiative.
The report highlights that current methane mitigation investment “is not enough to limit global warming to 1.5C” and must grow at least tenfold to meet the $110bn of private and public finance needed for the world to be 1.5C-aligned.
It adds that most methane finance was allocated in east Asia and the Pacific – the largest methane-emitting region – but Latin America, the Caribbean and sub-Saharan Africa all have “significant abatement potential”.
What are the biggest sources of methane emissions?
Agriculture
Agriculture is a significant source of methane – accounting for almost half of human-caused emissions, according to the IPCC. Livestock alone causes around 30% of human-caused methane emissions.
Methane emissions from agriculture and waste rose by one-sixth over 2000-20, according to the new Global Methane Budget.
Agriculture and livestock are responsible for the vast majority of methane emissions in countries with big farming sectors, such as New Zealand, Brazil and Ireland .
Almost 90% of New Zealand’s methane emissions trace back to agriculture. The country also has among the highest methane emissions per capita, ranking alongside fossil-fuel-producing countries such as Turkmenistan.
In Denmark, another big agricultural producer, the government recently proposed a world-first tax on greenhouse gas emissions from agriculture to help meet climate goals.
Methane is emitted through enteric fermentation, which takes place in the digestive system of ruminant animals, such as cows and sheep. The gas is produced by bacteria in the stomach during this process and then expelled from the animal, entering the atmosphere.

Daffodils, seaweed and other items are being tested as livestock feed to try and lower methane emissions. “Methane blockers” have also been proposed to reduce emissions from UK cows, alongside government-funded projects aimed to breed sheep with lower emissions. A methane-cutting vaccine is also in the works.
These projects are ongoing, with mixed results. A major commercial trial of a seaweed supplement for cattle in Australia saw methane emissions drop by 28%, rather than the “widely promoted” reduction of more than 80%, the Guardian reported.
In a separate Guardian article, a Swedish report found more promising methane reduction potential from feeding a type of seaweed to cows, but noted that more knowledge is needed.
Other agricultural methane emissions arise from the storage of animal manure. A 2023 study reviewed different methane-cutting methods of manure management, including aeration, slurry covers and chemical treatments.

Growing rice also leads to methane emissions. The staple crop for billions of people around the world accounts for around 8% of human-caused methane emissions, according to the UN. The gas is generated by decomposing organic matter in flooded rice fields.
In 2023, the World Bank approved a $255m loan to support a programme to reduce methane emissions and enhance “climate-resilient” rice production in Hunan province in China, one of the country’s biggest rice-producers.
Trials to reduce water usage and methane emissions and produce more rice have been gaining traction in China.
In other parts of Asia, different solutions aim to cut methane emissions from rice fields by draining and re-flooding fields more frequently.
Fossil fuels
About a third of human-caused global methane emissions come from the energy sector, according to the IEA.
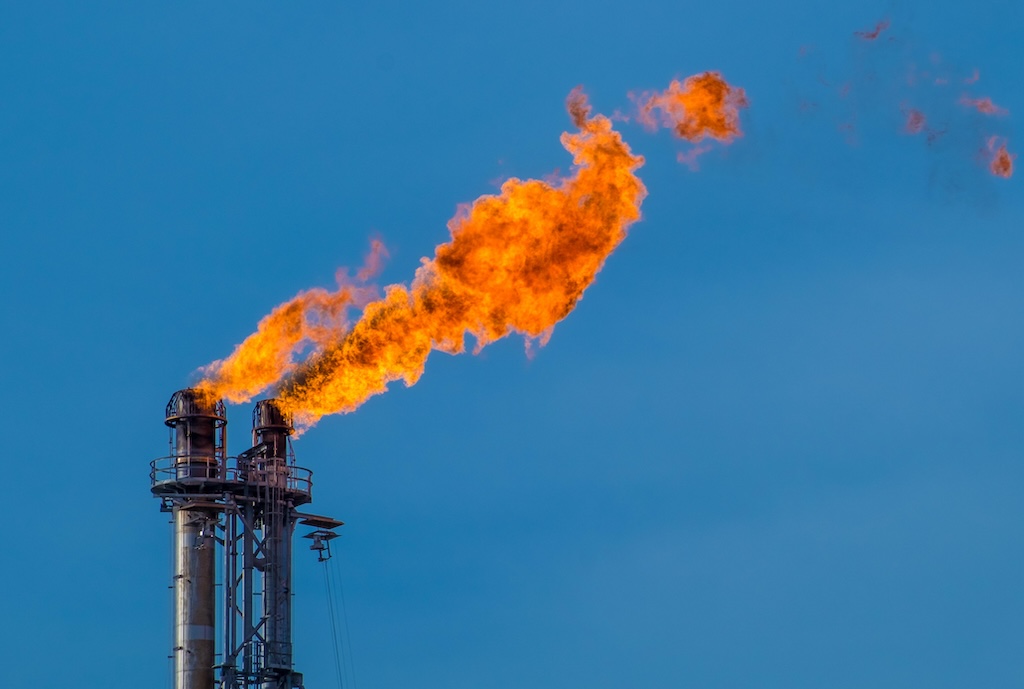
Methane emissions in the fossil fuel sector come from different processes, including leaks at different stages of oil, natural gas and coal operations and flaring natural gas – the burning of natural gas during oil extraction.
Efforts are underway to improve methane emissions measurements from oil and gas, from global to sub-national levels.
An international initiative called the Oil and Gas Methane Partnership 2.0, organised by the UN Environment Programme, lays out a set of practices for companies and organisations to ensure they will accurately and transparently report their fossil methane emissions. To date, 100 companies– accounting for 35% of oil and gas production – are part of the initiative.
The partnership is starting to see improvements in methane measurements, says Dr Paul Balcombe, senior lecturer in chemical engineering and renewable energy at Queen Mary University of London.
In 2020, the European Commission published its methane strategy, which will improve the detection and repair of leaks in gas infrastructure.
The EU methane strategy was complemented by a methane emissions regulation – proposed in 2021 and passed in May this year – which seeks to compel fossil fuel companies in the EU to measure, report and reduce their methane emissions, as well as those from fossil energy imports to the EU. Under this regulation, oil and gas producers are required to report their estimated emissions within 12 months after it comes into force.
This EU import standard could reduce one-third of global methane emissions from the oil and gas sector, according to an analysis by the Clean Air Task Force.
The regulation also orders fossil-fuel companies to “stop avoidable and routine flaring” and to carry out flaring and venting only in cases where it is “necessary for safety reasons”.
Dr Zitely Tzompa Sosa, research manager of the Methane Pollution Prevention team at the Clean Air Task Force, says global regulations have slowly moved from an engineering calculation-base to a measuring-base emissions inventory.
Under an engineering calculation approach, companies use data, such as the number of facilities multiplied by standardised emission factors, to estimate methane emissions. By contrast, a measuring-based inventory entails companies measuring their emissions through aeroplanes, drones or satellites, which improve their measurements by detecting major and small leaks of methane.
Tzompa Sosa adds that using measurements and emissions verification is critical to addressing methane emissions. She tells Carbon Brief:
“Verifying is key [to seeing that] your targets are being met. We don’t only want to be reducing reported emissions; we want to reduce real, immediate methane.”
For Balcombe, to reduce methane emissions in the oil and gas sector, countries and companies should understand their methane emissions and commit to fulfilling their methane targets. He says:
“Almost every possible emission source is possible to eliminate, but [companies] have to know about it, improve the design or operation of [their] equipment and work with [those] who are on the plant to understand that methane emissions and safety [are] a priority.”
According to an IEA report, “targeted actions”, such as repairing leaks to reduce methane emissions from fossil fuel production and use, are crucial to keeping warming to no more than 1.5C.
However, policies aiming to reduce fossil methane emissions have been less stringent than those for waste, according to a 2023 study. It adds that regulations primarily address emissions from burning (flaring) and intentional release (venting) of methane, rather than addressing fugitive emissions or abandoned oil and gas wells, which can continue to leak methane if not properly sealed off.
The study recommends economic instruments to incentivise companies to invest in emissions reduction, such as emission trading systems, taxes and fiscal instruments. It also suggests regulating methane emissions at each stage of a project, including abandoned facilities.
Wetlands
Around one-third of total global methane emissions come from natural sources – mainly wetlands, but also oceans and termites.
A wetland is an ecosystem that is covered in water for all or most of the year, including Arctic permafrost peatlands, tropical mangrove plantations and salt marshes.
When in good condition, wetlands provide key ecosystem services such as water filtration and are important carbon sinks.
When they are degraded, wetlands can release greenhouse gases including methane, CO2 and nitrous oxide back into the atmosphere. Vast swathes of wetland are degraded, with a 2023 study finding that Europe, the US and China have been worst hit by wetland loss.

A 2023 study found that methane emissions from wetlands have risen faster this century than in even the most pessimistic climate scenarios.
The waterlogged soils are releasing methane into the atmosphere more rapidly as climate change raises global temperatures and disrupts rainfall patterns. This is called the “wetland methane feedback”.
The 2023 research found that global warming “undermines the mitigation potential of pristine wetlands” and adds that there is “major uncertainty” over whether wetlands will remain a carbon sink as the planet warms. Allen tells Carbon Brief:
“Trying to manage wetlands, that’s a massive geoengineering task. You’d have to control the hydrology of wetland systems in pristine areas, in the tropics, in Africa…Really there is very little we can do on land management to control those biogenic emissions.”
Landfill
Food waste and other organic compounds breaking down in landfill sites are another significant cause of methane.
Waste accounts for 19% of global methane emissions from human activities, according to the Global Methane Budget. Greenhouse gases from food loss and waste account for around half of all global food-system emissions.
Earlier this year, the Guardian’s analysis of satellite data showed more than 1,000 “huge” methane leaks from landfill sites around the world since 2019.
Allen says landfill waste is a “growing international problem”– especially in countries with poor landfill regulation.
For example, according to a survey from the UK Environment Agency, one-fifth of all waste in England may be “illegally managed” by being burned, dumped or otherwise disposed of in unofficially managed ways.
Waste management – including landfill – made up around 4% of the UK’s greenhouse gas emissions in 2021, government statistics show. Methane comprised 90% of waste emissions, mostly from landfill sites.
According to the UK’s Climate Change Committee, methane emissions could be reduced by preventing waste, recycling and banning biodegradable waste from landfill, reducing residual waste sent to energy-from-waste plants, increasing landfill methane capture and improving wastewater treatment and compost facilities.
Jackson, R. B. et al. (2024) Human activities now fuel two-thirds of global methane emissions, Environmental Research Letters, doi:10.1088/1748-9326/ad6463


