Guest post: How scientists predicted CO2 would breach 400ppm in 2016

Richard Betts
11.08.16
Richard Betts
08.11.2016 | 4:23pmProf Richard Betts is head of climate impacts research at the Met Office Hadley Centre and chair in climate impacts at the University of Exeter.
In the late 1950s, when David Keeling began measuring atmospheric CO2 concentration at the Mauna Loa observatory in Hawaii, the concentration was around 315 parts per million (ppm). In 2016, it topped 400ppm for the first time.
While there is nothing physically significant about 400ppm in itself – it does not reflect any actual threshold in the climate system – it reminds us of the increasing extent of human influence on the climate.
Like an 10th or 100th birthday, a century in cricket, or the Millennium, we notice when the digits change in a big way, and it jolts our awareness of ongoing change.
As emissions keep rising, it was only a matter of time before we passed 400ppm. But forecasting precisely when it would happen was a useful test of our understanding of how climate and the carbon cycle interact. As it turns out, we got it virtually spot on.
Keeling curve
Soon after Keeling began making measurements of CO2, two features began to stand out in the iconic ‘Keeling Curve’. First, there was a noticeable seasonal swing, reaching a peak in May that was about 5ppm higher than the low in September.
Secondly, the whole cycle shifted upwards by about 1ppm each year. On average, CO2 concentrations were rising. Sixty years on and those features are still strong.
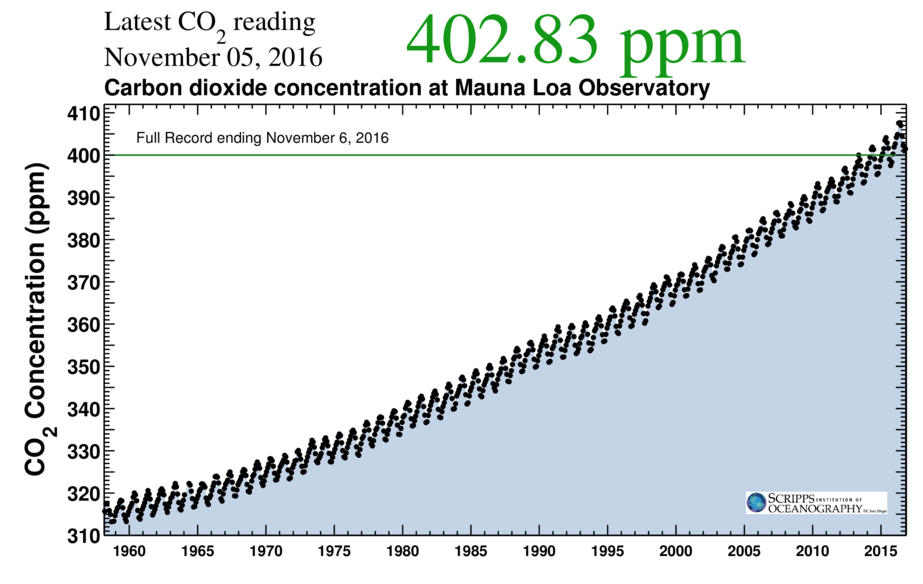
For the first time, the atmospheric CO2 concentration at Mauna Loa stayed above the symbolic milestone of 400ppm for the full year in 2016, including September’s seasonal low. Source: UC San Diego
Seasonal swing and CO2 fertilisation
Plants take up CO2 during the growing season in spring and summer. Since there is much more land and vegetation north of the equator, it is there that CO2 concentrations fall for a few months, as plants draw it down from the atmosphere. As growth ends in autumn and winter, leaves drop and decompose, raising CO2 again.
On longer timescales, plants grow more vigorously with higher carbon dioxide – a process known as carbon dioxide fertilisation. Worldwide, vegetation carbon storage and leaf cover are increasing in response to rising CO2.
This ‘global greening’ was predicted in the early days of Earth System modelling and has been reported in scientific papers and the IPCC for many years.
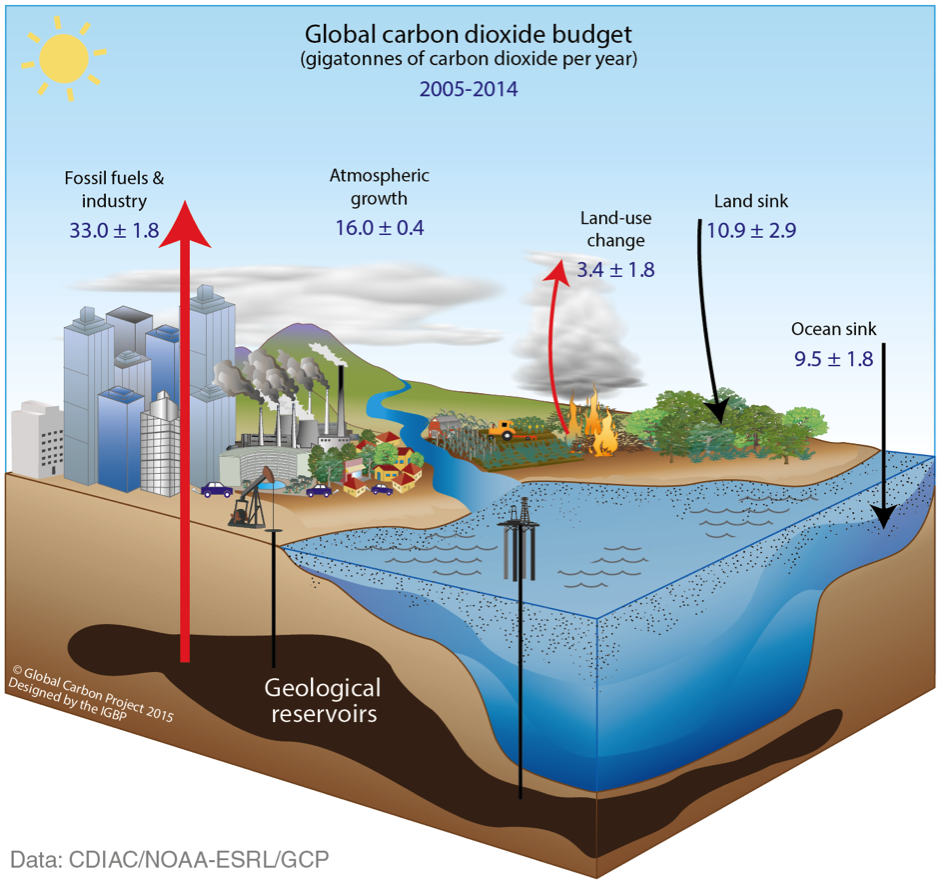
Over time, however, it has become clear that the rise in CO2 is not the same every year. In general, CO2 levels accelerated for several decades after the 1950s. During the 20th century, the fastest annual CO2 rise was 2.9ppm per year in 1997-1998.
Interestingly, for the first decade and a half of the 21st Century, the rate of rise stopped accelerating and steadied at around 2.1ppm per year. This is the topic of a new study published today by Dr Trevor Keenan and colleagues. They suggest this “pause” in the acceleration of carbon dioxide concentrations was, in part, due to the effect of the temporary slowdown in global average surface warming during that same period on respiration, the process by which plants and soils release CO2.
So, as carbon dioxide continued to rise, its fertilising effect on plants continued but respiration weakened for a while, strengthening the overall land carbon sink.
It is important to note, however, that CO2 was still rising during this period – it’s just that the rise was steady, not accelerating as it had done in the previous half-century.
El Niño effect
Faster increases in CO2 from one year to another can also be closely linked to El Niño, part of a prominent climate phenomenon known as the El Niño/Southern Oscillation (ENSO).
When an El Niño occurrs, CO2 tends to rise faster. This is largely because warm, dry conditions on tropical land areas weaken the carbon sink. Widespread forest fires, such as those in Indonesia during the major 1997/98 El Niño, lead to extra emissions.
Under the opposite conditions, known as a La Niña, the carbon sink tends to be stronger and the atmospheric CO2 rise less rapid. Even then, CO2 concentration rises because the stronger sink is still not enough to offset human emissions.
The graph below shows the strong statistical relationship between annual CO2 rise and the strength of El Niño and La Niña, as quantified by sea surface temperatures in the tropical east Pacific ocean.
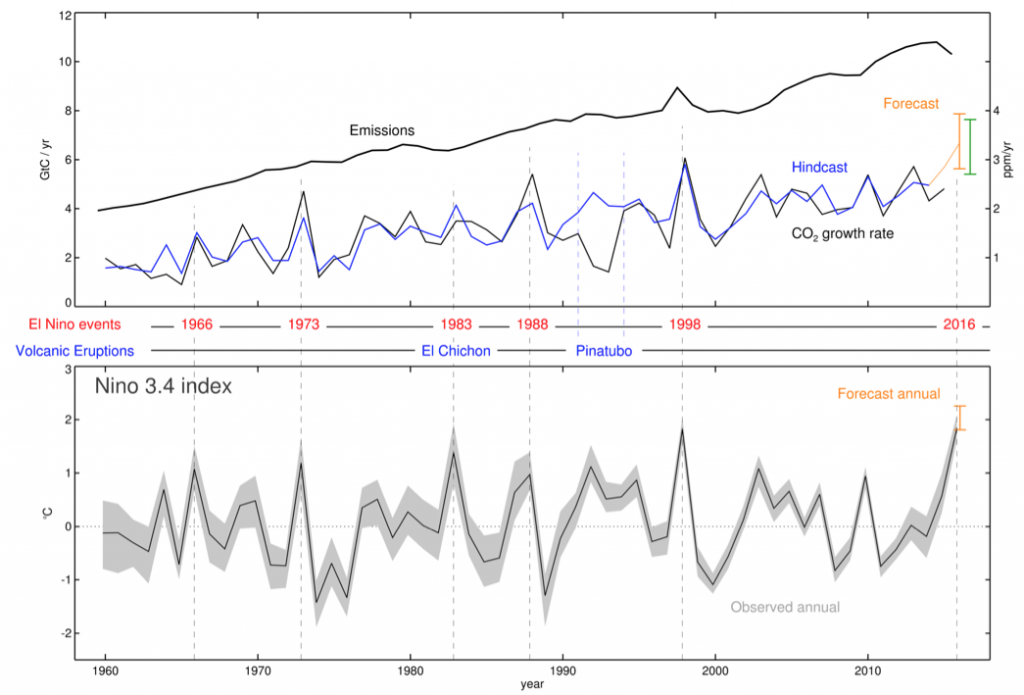
Top: Anthropogenic CO2 emissions (thick black line); CO2 growth rate (thin black line) and forecast for 2016 using the forecast (orange line and bar) and observed annual mean sea surface temperature (green bar). Bottom: Annual (April to March) mean SST anomalies in the Niño 3.4 region (grey shading) and its median (black line). Source: Betts et al (2016)
Passing the 400ppm milestone
How does knowing all this help forecast when we would breach the 400ppm mark?
In 2014, the seasonal swing took CO2 concentrations above 400ppm for the first time. They soon dipped back down again, as the summer greening kicked in. But a symbolic threshold had been reached. It was only a matter of time before it would be permanently passed. Based on recent years, it looked like this would take another three years. But then things changed again in 2015, as a large El Niño loomed.
In 2015, CO2 stayed above 400ppm for much of the year, making it the first year in which the annual mean concentration came in above the symbolic threshold. Yet, as expected, the September minimum remained below 400ppm.
Seeing the forecasts of a large El Niño, Ralph Keeling (son of David Keeling, and now leader of the Mauna Loa measurements at the Scripps Institute) predicted we’d see a large CO2 rise in the coming months, so much so that the following September would see concentrations above 400ppm –a year earlier than expected.
This presented scientists with a great opportunity to test our understanding. In collaboration with Ralph, our team at the Met Office Hadley Centre combined techniques from two normally separate areas of climate science – seasonal forecasting and carbon cycle research – to forecast CO2 concentrations for 2016.
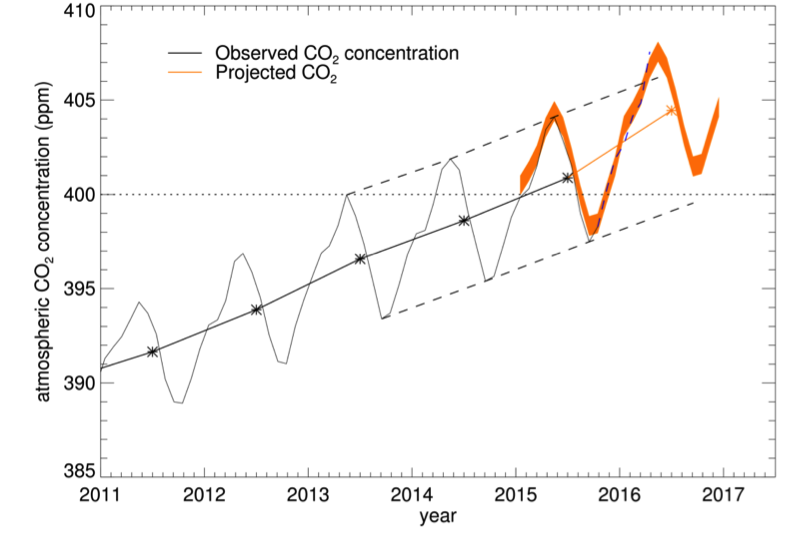
Monthly mean CO2 concentrations at Mauna Loa since 2010, also with observed and hindcast/forecast annual mean concentrations (black and orange stars and central solid lines). Source: Betts et al (2016)
We took a routine forecast of sea surface temperatures (SSTs) for the next six months from our climate model, combined this with observed SSTs from the previous six months, and applied the statistical relationship to give us our forecast.
As a result, we predicted the fastest year-on-year CO2 rise on record, up 3.15 ± 0.53 ppm from 2015. This is larger than recent years because of El Niño, and also larger than during the previous El Niño in 1997/98 because human emissions have risen since then. Emissions are now approximately 20% higher than in the late 1990s.
This, in turn, gave us a forecast of the average CO2 concentration in 2016 of 404.45 ± 0.53 ppm. Assuming that the seasonal cycle was the same as previous years (a crude but necessary simplification), we forecast a May maximum in 2016 of 407.57 ± 0.53 ppm, and a September minimum of 401.48 ± 0.53 ppm. With an actual May concentration of 407.65 ppm, it turned out that our prediction was almost spot-on.
In September, the observed CO2 concentration of 401.01 was slightly below our central forecast, but still within our published uncertainty bounds. As first predicted by Ralph, and then by our systematic approach, the September 2016 CO2 at Mauna Loa was indeed above 400ppm for the first time on record.

Feedbacks
Aside from the symbolic significance of 400ppm, it is worth reflecting on the implications of being able to successfully predict its passing.
Personally, I find it quite remarkable that we were able to predict the concentration of a gas in the atmosphere measured at a particular point on the Earth’s surface nearly a year in advance. Our climate model was able to forecast sea surface temperatures six months ahead well enough to give an accurate prediction.
The forecast of the record CO2 rise, and the unusually steady rise in CO2 that preceeded it, also illustrate the potential for feedbacks in the climate system. While rising CO2 is driving the ongoing global warming trend, variations in that trend are causing impacts on plants and ecosystems, which themselves affect the CO2 rise.
As the world’s climate continues to warm, we can expect to see further impacts on ecosystems, potentially leading to feedbacks on climate change. If the recent “slowdown” in global surface warming is reversing, the stronger land carbon sink seen in recent years may weaken again, and the rise in CO2 may quicken again.
So, although natural carbon sinks on land and ocean have buffered us from the full impact of our carbon emissions, we should not assume this will continue at the same level indefinitely. Crucially, the warmer the world becomes, the more difficult it could be to prevent further warming, as our CO2 emissions could have proportionally larger impacts, and natural carbon sinks could become less effective.
If the world’s nations are serious about halting global warming, the rise in CO2 concentrations also needs to cease. This means the annual change in CO2 concentration – generally 2ppm per year, and around 3ppm this year – needs to become zero. That is, the sinks need to balance the sources. Based on our current understanding of the carbon cycle, this task will be harder the longer we leave it.

