Guest post: Will plants help make the planet wetter or drier in a changing climate?

Multiple authors
11.05.19
Multiple authors
05.11.2019 | 4:06pmDr Justin Mankin is a climate scientist, assistant professor in the department of geography at Dartmouth College in New Hampshire, and principal investigator of the Dartmouth Climate Modelling & Impacts Group; Prof Richard Seager and Prof Jason Smerdon are both research professors at the Lamont-Doherty Earth Observatory (LDEO) of Columbia University in New York; Dr Ben Cook is a climate scientist at the NASA Goddard Institute for Space Studies and the LDEO; and Dr Park Williams is an associate research professor at the LDEO.
The way that plants and trees respond to a warming climate and increasing levels of atmospheric CO2 has a significant impact on how they use water.
But will this leave more or less freshwater available for societies to use? That millions of people suffer from life-threatening water stresses in the current climate tells us that the answer to this question really matters.
Our new study, published in Nature Geoscience, attempts to shed light on this complicated picture.
We find that in mid-latitude regions, such as North America, Europe and Central Asia, plants will consume more water in future, resulting in less water in soils and rivers – even where climate models say rainfall will also increase.
Wetting and drying
The two images below show the state of the second largest reservoir, Lake Oroville, in the world’s eighth largest economy, California, a mere three years apart. (Use the slider to switch between 2011 and 2014.) The cause of the drastic reservoir depletion on the right was a devastating drought from 2011-15, which cost farmers $2.7bn in 2015 alone.
Lake Oroville, CA on two dates, before (left) and in the heart (right) of the California drought. Credit: P. Hames & K. Grow, CA Dept Water Resources.Droughts such as these punctuate California’s history, but they are becoming more severe as the human impact on climate intensifies. Will such trends continue or are there other factors that may counteract the increasing drying of essential agricultural and economic areas?
The challenge in answering this question is that the models we use to project our climate futures can suggest both wetter and drier conditions, depending on the season and region. Model simulations are sensitive to how scientists characterise water availability and its change. Or it can depend on plants and their place in each of these worlds.
Consider the dry world: as the air warms in response to global warming, it demands more moisture. Over the continents this demand is satisfied by the water stored on land – drying soils and reducing river flow as a consequence. The picture of the world based on this theory is bleak – the atmosphere dries the land faster than it can be replenished.
You can see this in the image below, which shows an aridity metric called the “Palmer Drought Severity Index” (PDSI), averaged over the southwest US. Aridity metrics such as PDSI are calculated with output data from climate models, relying on a quantity called “potential evapotranspiration” (PET). PET is the amount of water the land surface and its vegetation could lose through evaporation and transpiration, respectively, assuming sufficient moisture is available.
In the model simulations in the chart below, you can see periods of wet and dry alternating over the past 1,000 years. But beginning in the 20th century, PDSI makes a precipitous dive towards drier and drier values. This picture of deep drying is also present in soil moisture changes estimated directly from the models, raising both alarm and questions.
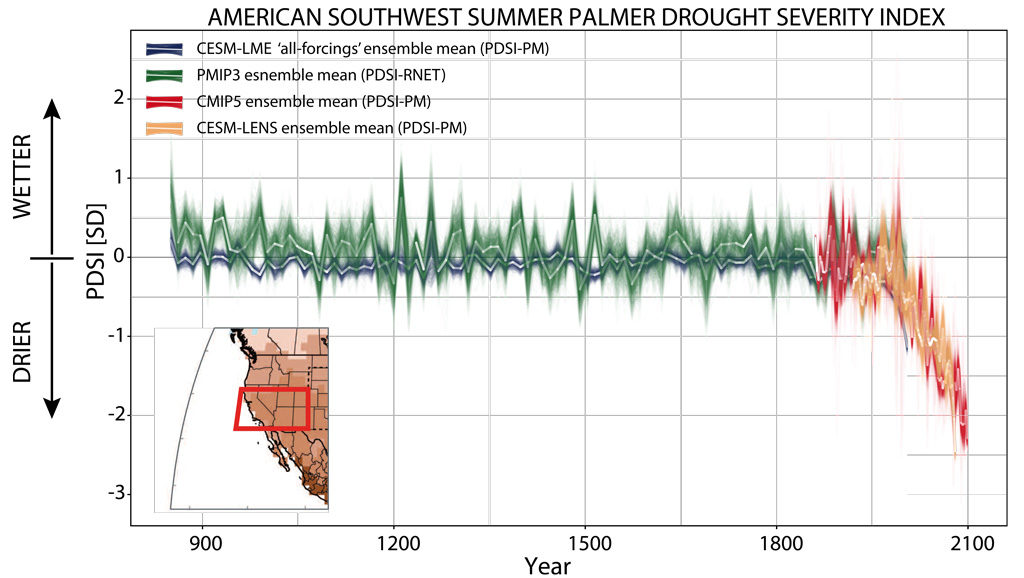
Variations in the PDSI aridity metric over the southwest US (inset map) from AD850 to 2100 in four ensembles of climate simulations. Adapted from Smerdon et al. (2017).
Now consider the wet world: This view centers on how plants will physiologically respond to increasing CO2, changing their water use and thus evapotranspiration.
Plants and the pores on their leaves are like straws, pulling water from the land and sending it to the atmosphere. In exchange, the atmosphere provides the plant with its carbon for growth. As CO2 concentrations increase in the air, plants can get the carbon they need for photosynthesis while reducing the amount that they open their pores. This reduces the size of the straw that the atmosphere uses to demand water, saving the plant water: the water cost of photosynthesis becomes cheaper and plants become more efficient – more carbon per drop. The side benefit for people is that it may leave more water in soils and streams.
Nevertheless, it remains that soil moisture and runoff projections from models can look consistent with the PDSI picture of future (despite the fact that PDSI does not consider how the straw size will change), complicating this problematic dichotomy of “wet versus dry”, or “dry versus less dry”.
A more detailed assessment of the many processes and hydrological variables represented in models is, therefore, a vital undertaking, if we are to better anticipate the future of water for people.
Warming and CO2 complicate the picture
Looking at the effects of CO2 increases on plant water consumption alone, field experiments and models agree – plants do tend to close their pores. But whether this leads to the anticipated water gains in the land is another story.
The problem is that this effect of plants closing their pores is happening in the future simulations while many other things are also changing – not least, temperatures, growing season length, and the amount, rate, form and seasonality of rainfall. Given the combined effects of higher CO2 and warming on plants and their water consumption, how does this picture of plants and their “wetting” influence relative to a dry world factor into a changing climate?
Our new study shows what the ensemble of state-of-the-art climate models say. The figure below encapsulates some of the results. The top-left map shows how the pores of plants will change the size of the atmosphere’s straw – what we call “canopy resistance” to evapotranspiration. The world is generally brown, meaning that the straw size is reduced, consistent with the plants-make-things-wetter story.
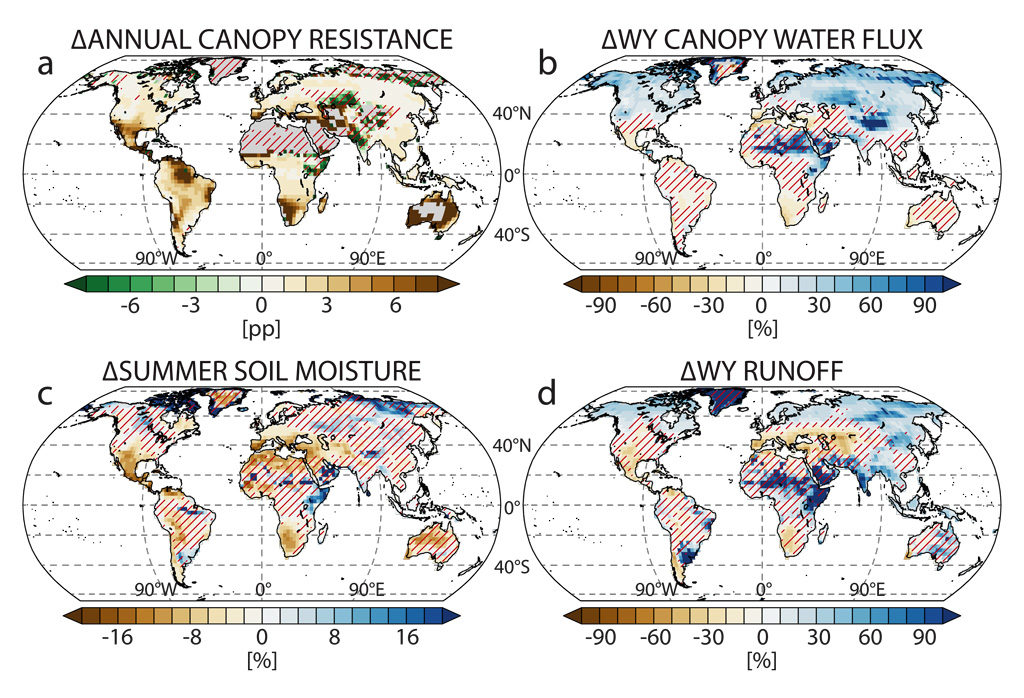
Maps of end-of-century changes in a high-emissions world (RCP8.5) in a) canopy resistance, b) canopy water flux, c) soil moisture, and d) surface runoff. WY is water-year (Sep-Aug in the Northern Hemisphere, Apr-Mar in the Southern). Hatching indicates places of uncertain change. Source: Mankin et al. (2019).
At the same time, the total amount of water that the atmosphere is getting from plants (the sum of transpiration and leaf evaporation) is going up in most of the northern hemisphere (top-right map in the above figure). This increase in ecosystem water use is not consistent with the plants-making-things-wetter story.
Indeed, the drying influences are clearly seen in projected soil moisture (bottom left) and runoff (bottom right), which show that there are places with declines in water at the land surface at the same time that there are decreases in straw size and additional water use by plants.
Understanding the model projections
So what can we make of this mixed picture? We can use the simple illustrations below to hypothesise some of what is going on.
The upper image shows the situation under the current climate. The rainfall that falls over a piece of land must be balanced by three factors: transpiration and leaf evaporation from plants (in green); the water flowing through and over the land (in blue); and everything else, such as soil evaporation and groundwater recharge (in red).
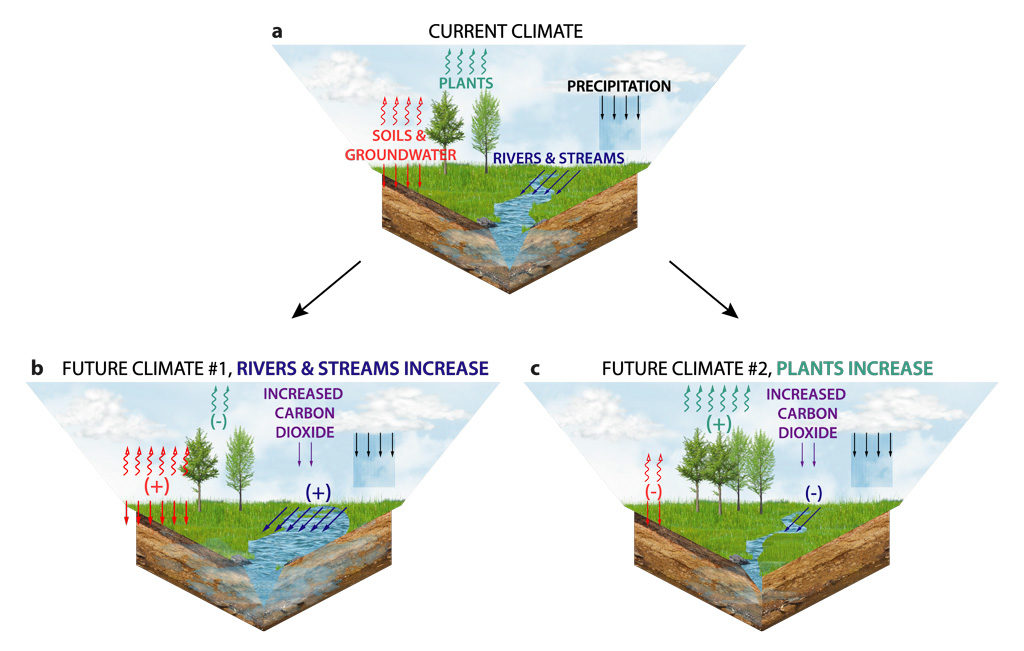
Illustration of moisture balance at the land surface in the present and future. Images show movement of moisture between incoming rainfall (black), transpiration from plants (green), groundwater storage and evaporation from soils (red), and surface runoff (blue). Images show a) current climate, b) a future where high CO2 and closed plant stomata decrease transpiration and increasing soil water and runoff, and c) a future where soil water and runoff decrease as longer and warmer growing seasons and CO2 fertilisation increase ecosystem water demands, leading to reductions in soil water and runoff. Source: Mankin et al. (2019).
In one version of the future (bottom left), increased CO2 reduces evapotranspiration and consequently creates more runoff. The models simulate the former, but not always the latter, even when rainfall is increasing.
In the other version of the future (bottom right), increased CO2 amplifies plant growth through CO2 fertilisation, and – when combined with longer and warmer growing seasons – plants consume more water, leaving less available in soils and streams.
What is pretty clear is that both of these effects are taking place – and one or the other dominates in most places. In other words, increased CO2 makes the straws smaller, but CO2 fertilisation leads to additional straws – while seasonal changes increase the time the atmosphere can drink from those straws.
So where will the future be consistent with the plants-make-things-wetter versus the plants-make-things-drier scenarios?
We estimate a quantity that we call the “blue water tradeoff” to answer this question.
In the figure below, brown shading indicates where future vegetation gains water to the detriment of future runoff, while blue shading shows the opposite. The blue hatching shows where the range of models consistently project increases in runoff.
It is clear that runoff changes are uncertain and variable, but in vast mid-latitude regions – such as North America, Europe and Central Asia – future plants will consume relatively more water, resulting in less water in soils and rivers, even where the models say rainfall will increase.
In other words, there are lots of important regions where plants will actually make land drier and leave less water for humans to use.
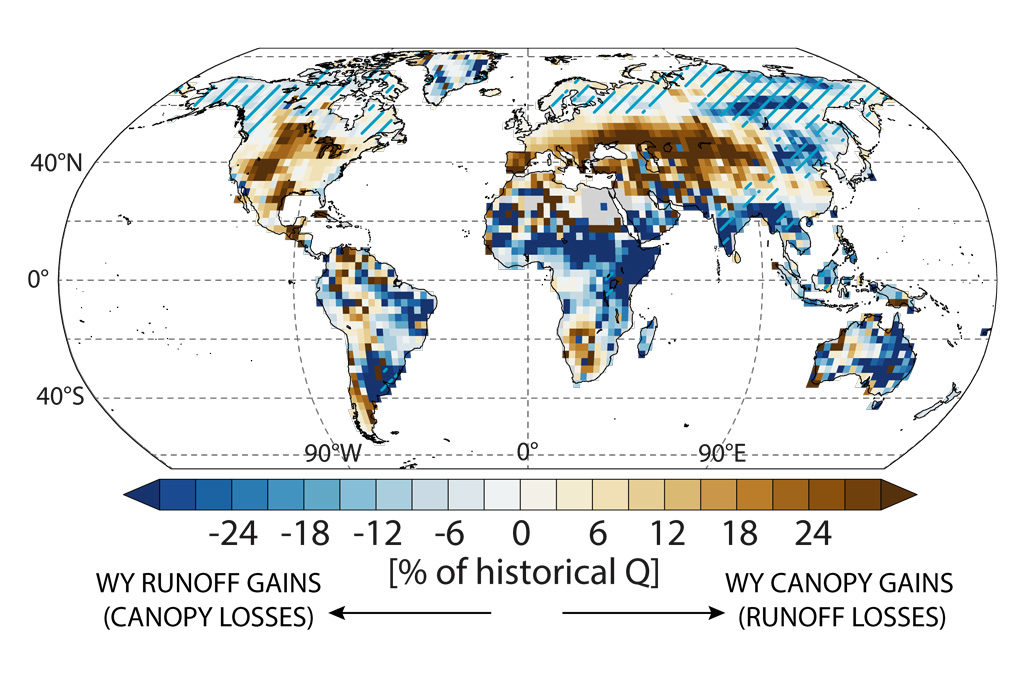
Map showing the “Blue Water Tradeoff” – the runoff lost (brown shading) or gained (blue) in the future due to plant responses to climate change. Expressed as a percentage of historical water-year (WY) runoff (Q). Source: Mankin et al. (2019).
Challenges and opportunities
Returning to the original question that we raised regarding whether the future will include more or less fresh water for people, our research points out that the answer is complicated.
The best answer for now is that it depends. It depends on the region, on the nuances of plant physiology, and vegetation responses to the combined effects of warming and CO2 that remain poorly understood.
Nevertheless, what is clear from the current generation of models is that plants are not a panacea for warming-driven land drying. For vast mid-latitude regions – where people need water and where modest changes in water availability can be extremely impactful – water decreases in soils and rivers as a result of plant responses to climate change.
Are the models correct? This is a crucial and unresolved question. Current models tend to overestimate the increase in global plant growth relative to observations from satellites. At the same time, models are incorporating richer treatments of land-surface process and, in particular, more complicated representations of vegetation, plus they are having an effect on model answers about surface water availability in the future.
How will plants allocate their carbon in the future? Will it all go to increasing the number of straws for the atmosphere? Important work on this question suggests not.
What about other limits on plant growth, such as nutrient availability? This question is largely unresolved, not to mention all of the shortcomings in the representation of soil-plant-atmosphere interactions. Whatever the answers are, however, they will certainly influence how we expect water use by both vegetation and humans to play out as the climate continues to change.
Freshwater is just a thin film on a massive planet, one that is stretched thinner by competing demands on it. Any changes in freshwater’s distribution in time or space – such as might happen from global warming – therefore has real human consequences.
Compound those supply changes with changing water demands – growing populations and their demands for food, energy and products – and it is clear why scientists want to help societies anticipate and plan for freshwater supply changes. Our work suggests that we have more work to do to inform these critical decisions.
Mankin, J. S. et al. (2019) Mid-latitude freshwater availability reduced by projected vegetation responses to climate change, Nature Geoscience, doi:s41561-019-0480-x
-
Guest post: Will plants help make the planet wetter or drier in a changing climate?

