Guest post: Why does the Arctic warm faster than the rest of the planet?

Dr Matthew Henry
02.11.22
Dr Matthew Henry
11.02.2022 | 10:00amWhile the Earth’s surface as a whole has warmed by around 1.2C since the industrial revolution, temperatures are not rising at the same rate in all corners of the world.
One difference is the faster pace that land areas are warming compared to the ocean. But perhaps the biggest outlier is the Arctic, which is warming more than two times faster than the global average (pdf).
This phenomenon – known as “Arctic amplification” – is causing dramatic changes for Arctic communities and has also been linked to extreme weather events in the mid-latitudes of the northern hemisphere.
The cause of this rapid warming is typically identified as the changing “albedo” of the Arctic’s surface – where the loss of snow and sea ice means less incoming sunlight is reflected back out to space.
But the reality is a little more complicated than that. In a new paper, published in Frontiers in Earth Science, my co-authors and I unpack the different factors that are contributing to the fast pace of change in the Arctic.
Amplified warming
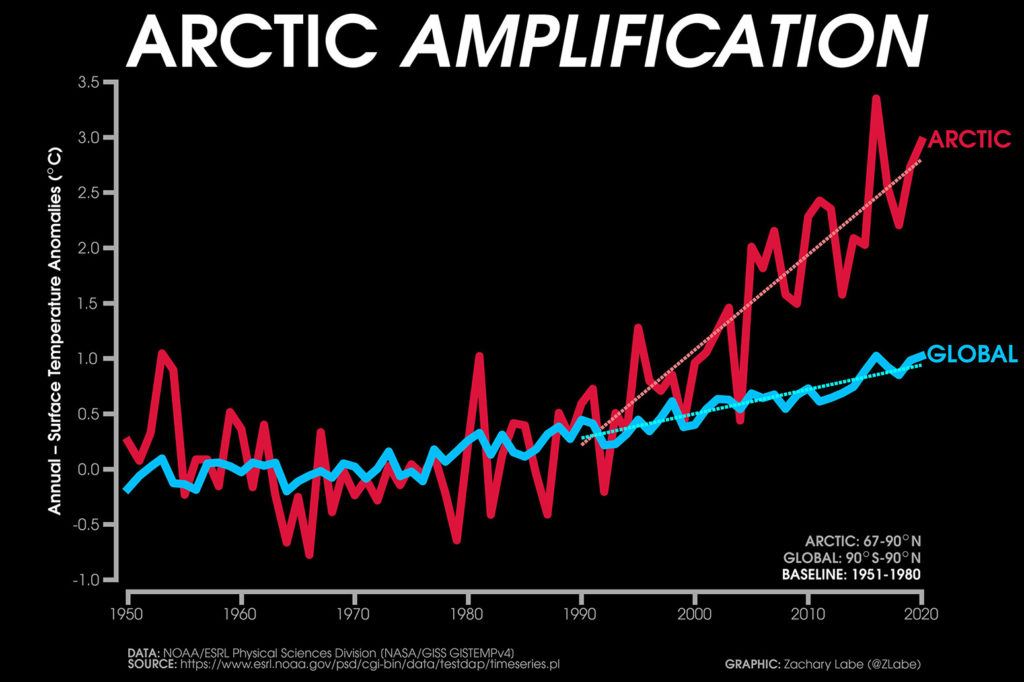
The chart below shows annual average surface temperatures, relative to 1951-80, for the whole planet (blue line) and the Arctic (red). Since around 1990, the Arctic is clearly warming faster than the rest of the planet.
This amplified warming in the Arctic is often solely attributed to the surface-albedo feedback. Back in 1896, the Swedish chemist Svante Arrhenius noted that “those places that alter their albedo through the progression or regression of the snow-covering…will probably remove the maximum effect [of increased carbon dioxide] from lower parallels to the neighbourhood of the poles”.
The reasoning is simple: ice and snow are white and therefore reflect a lot of the incoming sunlight. After an initial warming and melting of the snow and ice, the white surface gets replaced with a darker surface of the open ocean, which absorbs more sunlight, thus leading to additional local warming.
While it is understood that the reasons for amplified Arctic warming are more complex than just the surface albedo feedback, the simplicity of this mechanism has captured the narrative around Arctic warming, especially in the public.
Depending on how it is calculated, the surface albedo feedback may account for 30% to 60% of the total Arctic warming. However, the other processes described below trigger the surface albedo feedback (role of water vapour) and confine Arctic warming to the surface (absence of convection). Hence it is hard to accurately quantify how much a single process is responsible for Arctic warming.
Convection
While there is only one Earth to observe, we can use climate models to look at the pattern of warming in a world with no ice. Many models have found that, in the absence of sea ice or when sea ice has completely melted in high emission scenarios, the warming pattern is still amplified in the Arctic – albeit less so than when sea ice is declining.
Much like how biologists study bacteria, fruit flies and mice to infer knowledge about the human system, climate scientists use a hierarchy of climate models to understand the complex Earth system.
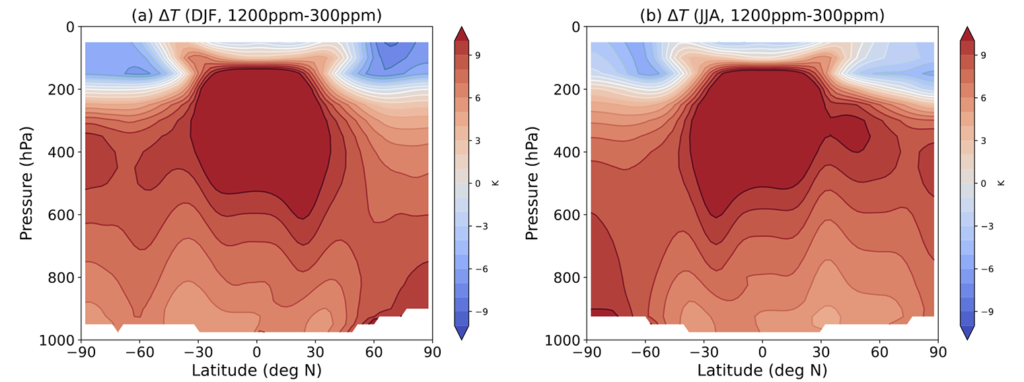
For example, the figure below is from an idealised climate model which has no ice, no clouds and no ocean circulation. Although this basic model is not as accurate as the comprehensive models used to simulate the impact of future emission scenarios, it helps us to gain an understanding of the climate system as it is simpler to understand.
The charts show the difference in atmospheric temperature during the winter (left) and summer (right) across the planet between a world with a very high atmospheric CO2 concentration (1,200 parts per million, ppm) and a pre-industrial world (300ppm). (For comparison, global CO2 levels are currently around 410ppm.) The x-axis indicates latitude, from the south pole (-90 degrees north) on the left to the north pole (90 degrees north) on the right.
Most noticeable in the charts is the warming in the upper troposphere (around 200 hPa) in the tropics throughout the year – shown by the large patch of red from -30 to 30 degrees north. However, you can also see a patch of red at the Earth’s surface (around 900 hPa) in the Arctic during winter. Even in this hypothetical world with no ice or clouds, the Arctic warms around 1.5 times more than the rest of the planet for the year as whole.
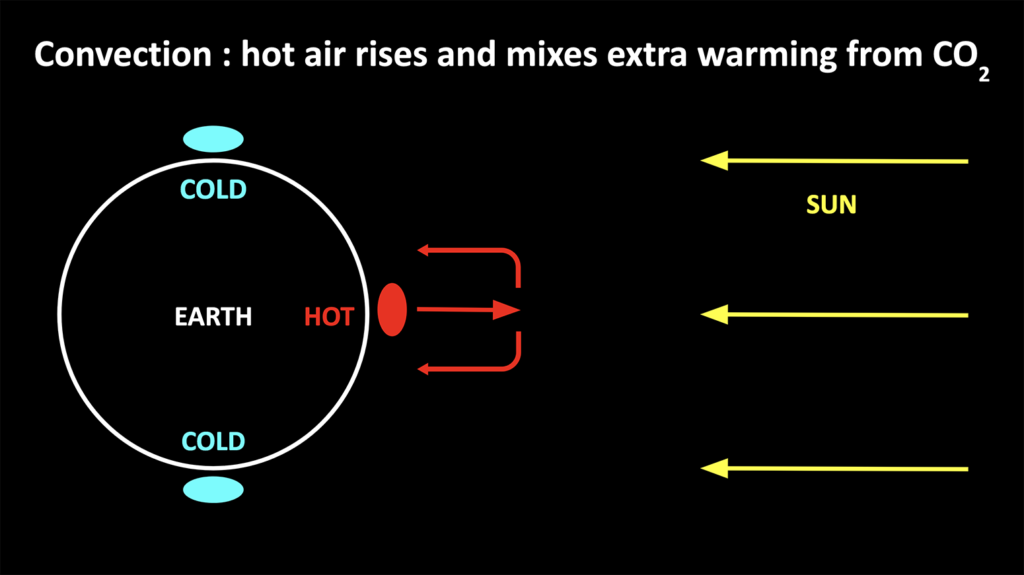
One of the key reasons more warming occurs at high latitudes – even in the absence of sea ice – is the absence of convection at high latitudes.
Convection occurs when air close to the ground is heated by the warm surface of the Earth. The warmed air is lighter than the cold air above and so starts to rise. In the tropics, the ground – and the air directly above it – is always heated by the sun, hence there is a lot of convection and the atmosphere is “well mixed” with so much rising air.
At high latitudes, however, the angle between sunlight and the surface means the incoming sunlight is less concentrated on the surface. As a result, the atmosphere is mostly heated by warm moist air coming from the tropics, which means there is much less vertical mixing.
The added warming from the CO2 and other greenhouse gases that humans have emitted generally heats the atmosphere most near the Earth’s surface. In the presence of convection, this warming gets mixed vertically. However, at high latitudes – such as the Arctic – the absence of convection causes the warming from greenhouse gases to be larger near the surface.
Water vapour
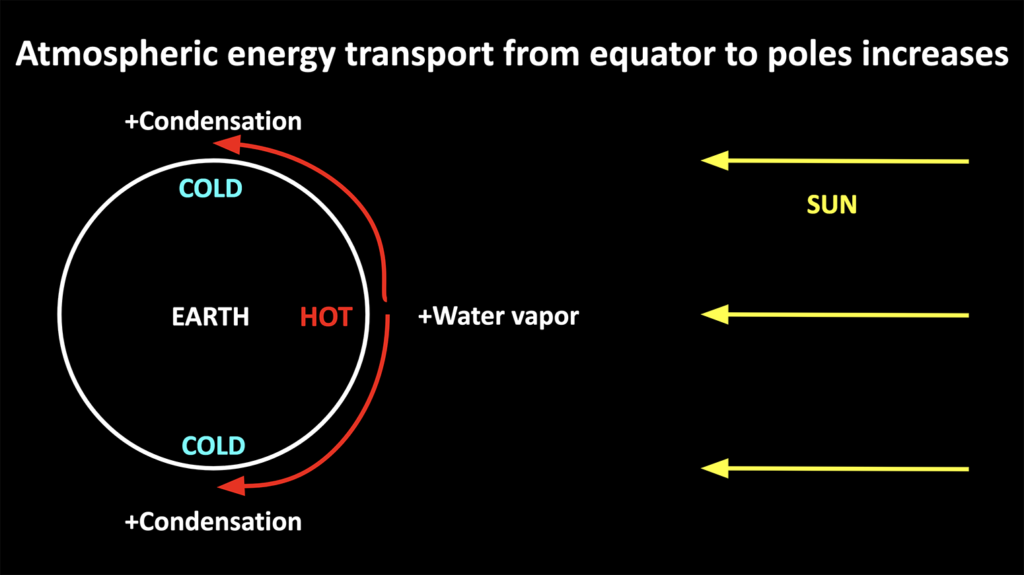
Another key reason for amplified warming in the Arctic is the increase in transport of water vapour from the equator to the poles.
The warm moist air from the tropics gets transported to the poles by the circulation of the atmosphere, and keeps the difference in temperature between the equator and the poles relatively small.
As a warmer atmosphere can hold more moisture, we expect there to be more water vapour in the tropical atmosphere as global temperatures rise. This additional moisture gets transported to the poles, where it condenses and releases heat.
Moreover, the extra water vapour in the Arctic atmosphere leads to an increased greenhouse effect and affects cloud formation, both of which can lead to additional Arctic surface warming.
Seasonal differences
An additional important feature of Arctic amplification is that it occurs mostly in winter.
This is mostly due to Arctic sea ice decline. Liquid water has a large “heat capacity” – it takes a long time to heat up and cool down. Hence when sea ice melts in summer and early autumn, it leads to an increase in sunlight absorbed by the Arctic ocean.
This stored heat is then released in winter when there is no sunlight and the atmosphere is colder than the underlying Arctic ocean.
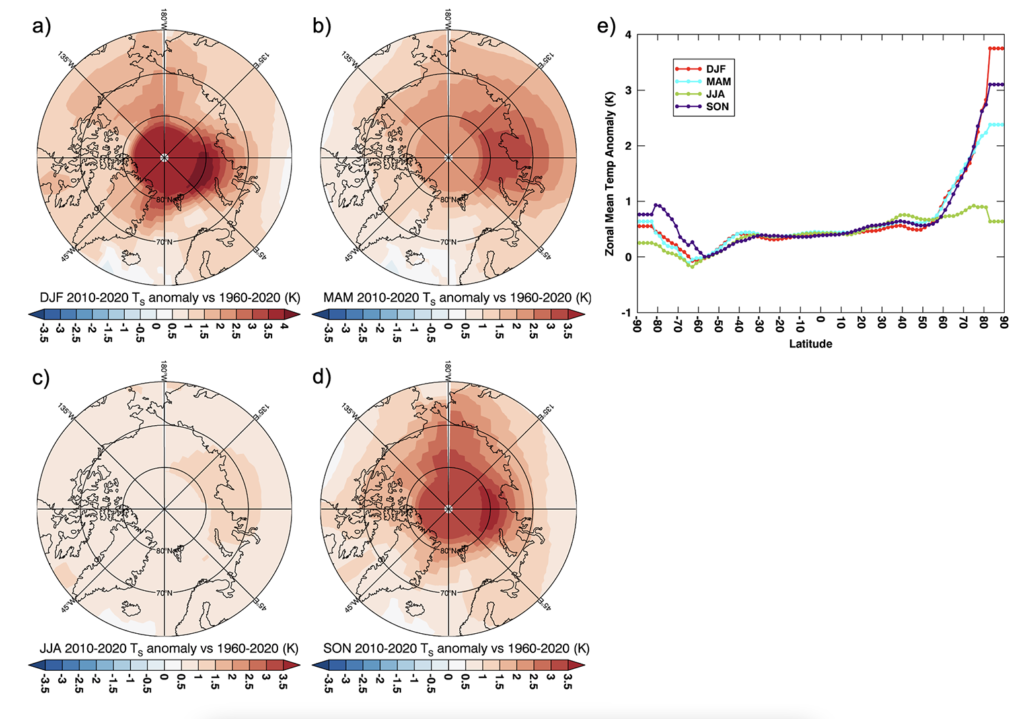
The maps below highlight the difference in surface temperature between averages taken over 1960-2020 and 2010-20 in the northern hemisphere winter (top left) and summer (bottom left). The darkest red shading indicates the largest temperature rise.
The plot on the right shows the same temperature change as an average at each point of latitude across the Earth – from the south pole (-90 degrees north) on the left to the north pole (90 degrees north) on the right. This again shows how Arctic amplification is predominantly a winter (red line) phenomenon.
The absence of convection and water vapour also affect Antarctica and lead to amplified Antarctic warming. However, it is weaker relative to the Arctic because of the high elevation of the Antarctic continent and smaller surface albedo feedback. Also, it is delayed due to the Southern Ocean circulation, which brings up cold water from the deep ocean and cools the surface.
Proxy data
The simplicity of the ice-albedo feedback has captured the narrative around Arctic amplification. However, this pattern of warming is now understood to be a fundamental feature of a moist atmosphere with little convection at high latitudes.
The Earth has kept a record of its past climates, and scientists today can analyse various “proxies” – such as shells, stalactites, pollen and seal pelts – to deduce the global climate going back many millions of years.
Studies of the climate in the distant past have shown that, regardless of whether the climate was colder or warmer, the surface temperature change was still amplified in the Arctic.
And even if global temperatures rise to the point where all Arctic sea ice melted – not a prospect that anyone would want – we would still expect warming to be faster in the Arctic.
Taylor, P. C. et al (2022) Process drivers, inter-model spread, and the path forward: A review of amplified Arctic warming, Frontiers in Earth Science, doi:10.3389/feart.2021.758361

