Guest post: How 12 key industries can cut emissions in line with 1.5C

Guest Authors
05.16.22
Guest Authors
16.05.2022 | 2:39pmSeven years after the 2015 Paris Agreement, a growing number of countries and companies have committed to achieving net-zero emissions by 2050.
Among the private-sector net-zero targets, those of the financial industry have the highest capacity to mobilise capital and direct it towards climate solutions. Yet there has been a lack of detailed sectoral information on what a net-zero aligned investment decision should look like.
Our new research sets out energy-related carbon budgets for each of 12 key industry and service sectors, including aluminium, power, cement, steel and aviation. The work, for the European Climate Foundation and the UN-convened Net-Zero Asset Owner Alliance (NZAOA), representing 71 institutional investors with over $10.4tn in assets, shows for the first time how much carbon dioxide (CO2) each sector can emit while likely keeping warming below 1.5C.
For example, our model pathway suggests both coal and internal combustion engine cars should be phased out by 2030 in wealthy countries if warming is to be limited to less than 1.5C.
In addition, we offer the first robust accounting of sectoral emissions, according to standard classification standards and the widely used Greenhouse Gas Protocol, which divides responsibility between “Scope 1, 2 and 3”. This should allow for transparent and consistent tracking of corporate emissions targets, avoiding double counting or “creative accounting”.
Our findings offer freely available datasets that can help climate activists, asset owners and others navigate, implement and track scientifically robust and truly accountable net-zero targets.
Sectoral carbon budgets
Last August, the Intergovernmental Panel on Climate Change (IPCC) identified in the first part of its sixth assessment report (AR6) the carbon budget for limiting warming to 1.5C.
For a likely (67%) chance of staying below this limit, the IPCC found a remaining global carbon budget of 400bn tonnes of CO2 (GtCO2) – or just 300GtCO2 for a higher 83% likelihood.
Our research is based on the 400GtCO2 budget and excludes technological carbon dioxide removal (CDR), such as direct air capture (DAC) or bioenergy with carbon capture and storage (BECCS), given uncertainties over their cost, availability, speed and effectiveness.
We then divide this remaining carbon budget between sectors using our One-Earth-Climate-Model (OECM), an integrated assessment model of the world’s climate and the global economy.
Our analysis covered 12 key sectors:
- Aluminium
- Chemicals
- Cement
- Steel
- Textile and leather industry
- Power utilities
- Gas utilities
- Agriculture
- Forestry
- Aviation and shipping industry
- Road transport
- Real estate and building industry
In order to explore the required technical details, the pre-existing OECM had to be significantly improved. In a nutshell, the newly developed energy model determines energy demands for 12 industry and service sectors – with various additional subsectors.
Energy demand for each sector is based on a projection of future production volumes – for example, millions of tonnes of steel – or on the assumed economic trajectory in GDP per year.
In a second step, we developed an energy supply “concept” – a tailored solution to meet the specific types of energy needs of each of the 12 sectors in our analysis. This allows the model to select energy sources to meet sectoral demand, according to a balance of costs and expected energy-related CO2 emissions.
The methodology of this updated One Earth Climate Model 2.0 has recently been published in the peer-reviewed scientific literature.
We base our socioeconomic assumptions, including global population and economic development until 2050, on those in the International Energy Agency (IEA) Net Zero by 2050 scenario, published last year.
In comparison to this pathway, we used a lower carbon budget and excluded CDR.
The OECM also has a higher technical resolution, meaning that the energy demands for each sector are modelled in detail. The energy demand of the aluminium industry, for example, is determined by the energy required to produce primary aluminium – including the energy demand for bauxite mining – while the energy demand for secondary (recycled) aluminium needs an entirely different manufacturing process and does not need additional bauxite mining.
The energy supply needed for specific manufacturing processes, such as industrial process heat of 500C, is taken into account for the energy supply concept as well. This level of detail allows us to determine industry-specific parameters needed for target setting.
Furthermore, the OECM pathway sees rapid renewable energy expansion and nature-based carbon sinks, such as reforestation, playing a significant role, which requires a close coordination between climate mitigation and nature conservation measures.
Key results from our new OECM scenarios are industry-specific emission intensities per year, a measure of the CO2 emissions per unit of production. This allows for a trajectory to be set for each industry on two levels: first, the specific emissions, such as CO2 per tonne of steel or CO2 per passenger kilometre for road transport; and, second, the total sectoral emissions.
The first level can be used by institutional investors – those managing assets in the steel industry, for example – to set 1.5C-aligned key performance indicators (KPIs) and intermediate targets for individual plants or companies, based on the emissions intensity of production over time.
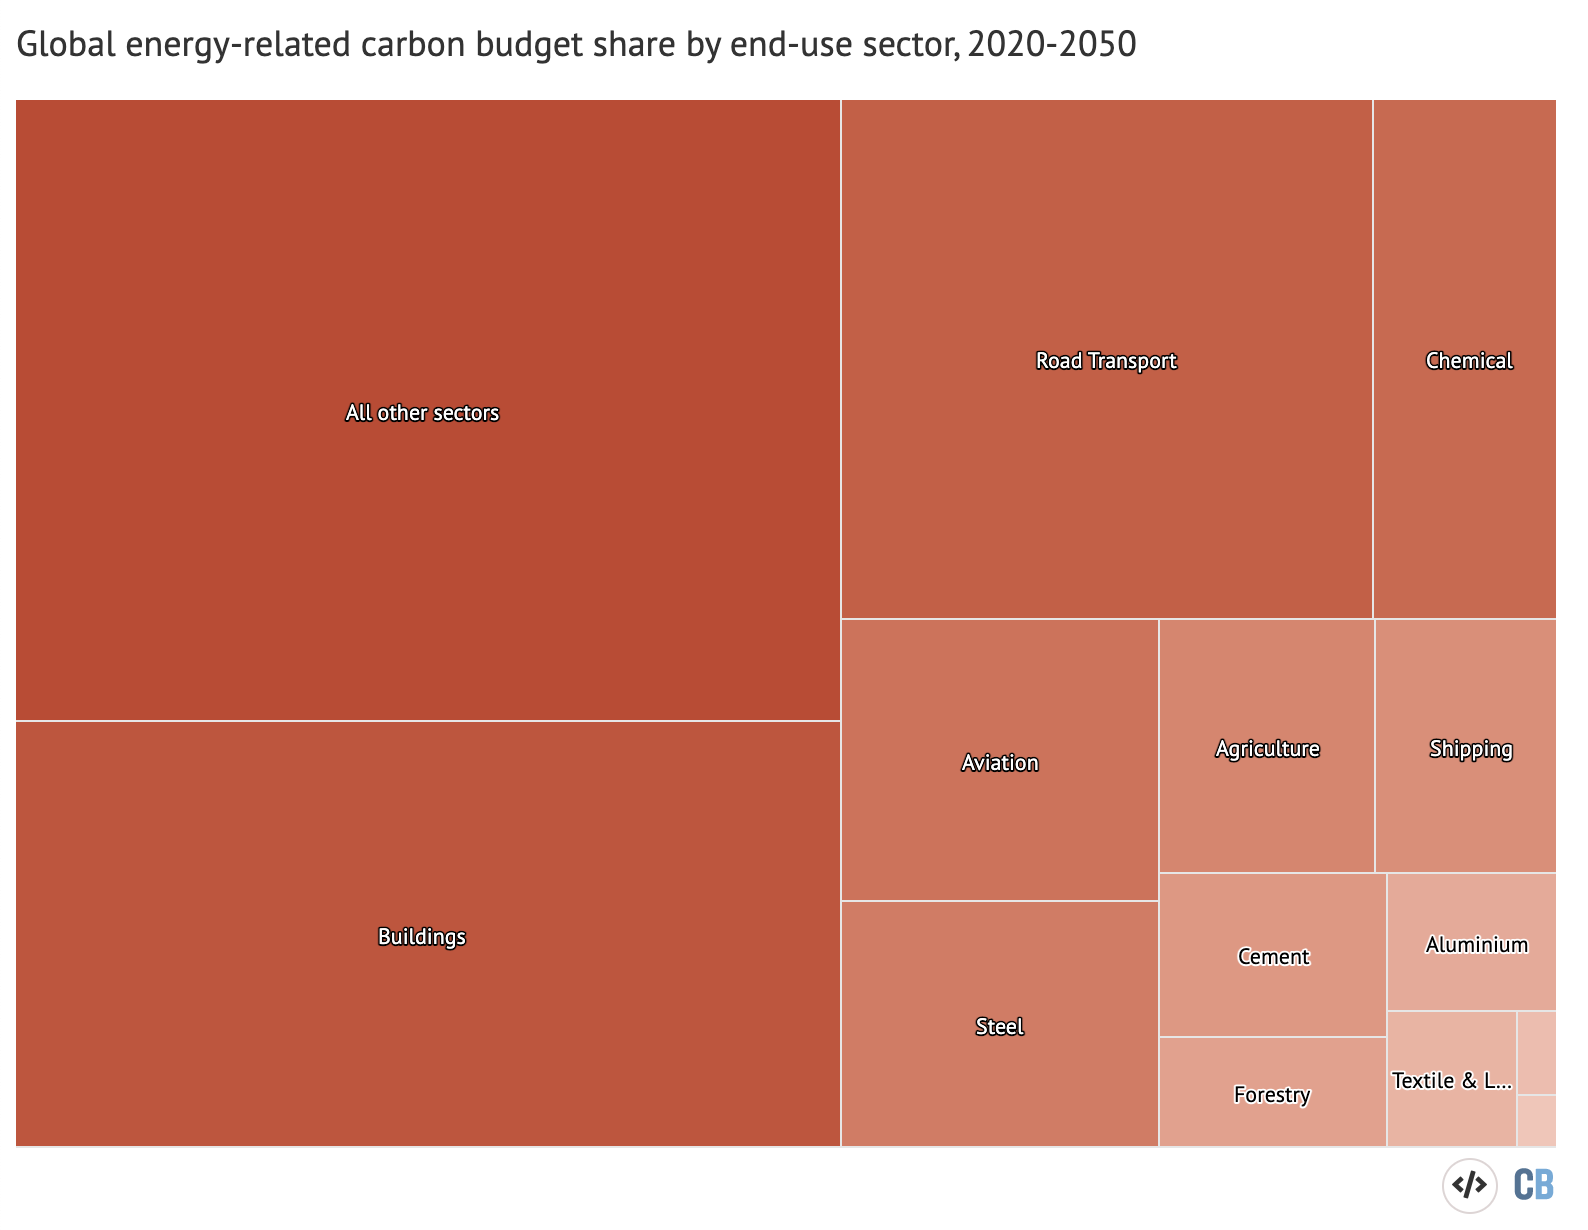
The second level provides carbon budgets broken down by industry. In our 1.5C pathway, for example, the steel industry has a carbon budget of just 19GtCO2 – about 5% of the global total.
This sectoral breakdown of the remaining carbon budget is shown in the chart below.

Our new research gives detailed energy scenarios, KPIs and carbon budgets aligned with 1.5C for each of 12 key industry and service sectors, providing for the first time concrete net-zero pathways for financial institutions and the real economy. It will allow activists, companies or investors to set and measure progress against 1.5C-compliant pathways at a sectoral level.
Avoiding double-counting
In addition to offering sectoral carbon budgets and pathways, our research also includes breakthrough findings on how to assign responsibility for emissions, without double-counting.
We draw on the Greenhouse Gas Protocol, a global corporate GHG accounting and reporting standard that has been developed over the past decade and distinguishes between three ‘scopes’:
- Scope 1 emissions occurring directly from sources owned or controlled by a company;
- Scope 2 emissions indirectly resulting from the generation of purchased energy;
- Scope 3 emissions indirectly resulting from the “value chain” of the reporting company and not included in Scope 2.
For example, a company that operates an aluminium smelter is directly responsible for the emissions caused by the production process on site – Scope 1 – such as emissions attributed to burning gas to provide heat for the melting process.
Emissions from purchased energy, such as the electricity the aluminium company buys from a power utility, fall under Scope 2.
Finally, employees’ business travel, emissions due to the use of the company’s products and other indirect emissions fall within Scope 3.
While Scope 1 and 2 emissions are clearly defined, Scope 3 emissions overlap with all other sectors – such as the aviation industry, or emissions from food served in the smelter’s cafeteria.
Historically, accounting methodologies for Scope 3 emissions have been calculated at company level, rather than on an industry and/or country level.
Data granularity thus remained a challenge since it was possible to find data on single sectors, such as air travel, but it was not possible to attribute this data by industry, such as the air miles flown for business activities of the steel industry.
This has been an issue for investors, who have been aiming to set net-zero targets for clearly defined industries.
Our new research is groundbreaking in that it delivers a new methodology to clearly delineate Scope 3 emissions and to avoid any double counting.
The industry sectors themselves can be defined by the Global Industry Classification Standard (GICS), a widely-used scheme for classifying industries by principal business activity.
This prescribes where the steel industry sector starts (with iron ore mining) and where it ends (with raw steel products). The emissions are then defined in three divisions: the primary industry, the secondary industry and the end-use sector.
The oil, gas and coal industry belong to the primary energy industry and their Scope 1 emissions are those related to the extracting and refining processes. Power and gas utilities are part of the secondary energy industry, because they purchase fuels from the primary industry, convert them into electricity or heat, and/or transport natural gas to the end users. End-users are all industries and businesses that use energy.
We are the first to have calculated Scope 1, 2 and 3 emissions for the primary and secondary energy industry as well as for the end-use sectors – according to the GICS standard – and without double counting, as shown in the figure below.

In addition to following the GICS standard, our researchers also systematically matched sectors to their classifications under the alternative BICS and NACE codes. This leaves no room for black-box methods or “creative accounting” that can obscure responsibility for emissions.
Financial sector
The value of our new research is that it provides the needed data for the financial sector to set net-zero targets and to understand where private capital is specifically needed as the world cuts emissions and attempts to limit warming.
For example, our model pathway suggests both coal and internal combustion engine cars should be phased out by 2030 in wealthy countries if warming is to be limited to less than 1.5C. To achieve this, power utilities and electricity suppliers would have to play a central role. They would have to provide electricity from renewable sources in sufficient quantities for energy-intensive industries and for electric cars, requiring significant scaling up.
Our new research and open datasets do not claim to be the only possible way to achieve the objective of limiting global warming to 1.5C, but rather offer free, accessible and scientifically sound data for climate activists inside and beyond financial institutions such as asset owners, managers, banks and insurers.
Thus, we offer a very detailed energy trajectory to help establish transparency and comparability in the maze of how to credibly implement – and track – accountable net-zero targets.
Teske S. et al. (2022) Limit global warming to 1.5C: Sectoral pathways and key performance indicators, University of Technology Sydney for the UN-convened Net Zero Asset Owners Alliance. This research was supported by the European Climate Foundation, which also funds Carbon Brief. Responsibility for the information in the report lies with the authors.

