Guest post: China’s wind and solar potential is ‘nine times’ that needed for carbon neutrality

Guest authors
06.20.22
Guest authors
20.06.2022 | 8:00amIn September 2020, China pledged to peak its carbon dioxide (CO2) emissions by 2030 and achieve “carbon neutrality” by 2060.
In a new study, published in Carbon Neutrality, we explore whether China has sufficient wind and solar potential, given that decarbonising its energy system will be key to meeting its climate goals.
At the end of 2020, China’s installed capacity for wind and solar power was 280 and 250 gigawatts (GW), respectively. While China aims to increase the combined total to 1,200GW by 2030, some research institutions believe that 6,000GW – more than 10 times the current level – is required to achieve carbon neutrality.
To assist policymakers’ understanding as to whether this is technically possible, we systematically assessed the potential of wind and solar power in China, based on high-resolution climate data.
We found that the technical potential of current wind and solar technologies in China is about 56,550GW, some nine times the level needed for carbon neutrality.
Carbon neutrality
In order to avoid dangerous global warming and meet the temperature control goals set out under the Paris Agreement, many countries have proposed net-zero or carbon-neutrality targets. In September 2020, China announced dual climate goals of peaking CO2 emissions by 2030 and achieving carbon neutrality by 2060.
Meeting both goals will require China to decarbonise its energy system. In 2020, CO2 emissions from energy consumption accounted for 87% of China’s total emissions. In the same year, energy sourced from non-fossil fuels accounted for just 15.9% of total energy consumption.
As of end-2020, the installed capacity of wind and solar power in China was 280GW and 250GW, respectively. At the United Nations Climate Ambition Summit in December 2020, President Xi Jinping proposed that the total installed capacity of the two renewables in China should more than double to over 1,200GW by 2030. According to some China-based research institutions, the installed capacity of wind and solar power will need to reach 6,000GW – more than 10 times the current installed capacity – to achieve carbon neutrality.
This calculation has led to debate among policymakers over whether China has the wind and solar photovoltaic (PV) power potential to meet its carbon-neutrality targets.
To answer this question, we systematically assessed the technological potential of wind and solar PV power generation in China, based on high spatial-temporal resolution climate data.
The climate data was supplemented with information on the location of nature reserves and urban areas, on the slope of the land, on relevant government policies and on the expected cost of site-appropriate wind or solar equipment.
This enabled us to refine the theoretical potential – based only on wind speeds or solar irradiation – into a realistic technical potential that excludes protected or urban areas, as well as locations where wind or solar installations would be unlikely to generate an economic return.
High resolution
In this paper, we used an assessment methodology based on “geographic information system” data to investigate China’s wind and PV power generation potential.
First, we calculated grid-scale wind and solar potential by combining the characteristics of standard wind turbine and PV modules, with high spatial-temporal resolution climate data. Then, we factored in technical, policy and economic constraints to better evaluate and refine our findings.
While China has long been known for being “rich in coal, but lacking in oil and gas”. Based on our findings, we suggest that this expression deserves an addendum referencing the country’s rich renewables potential, particularly in wind and solar energy.
With current technology, China’s wind and PV installed capacity potential is about 56,550GW, approximately nine times that required under the carbon-neutral scenario.
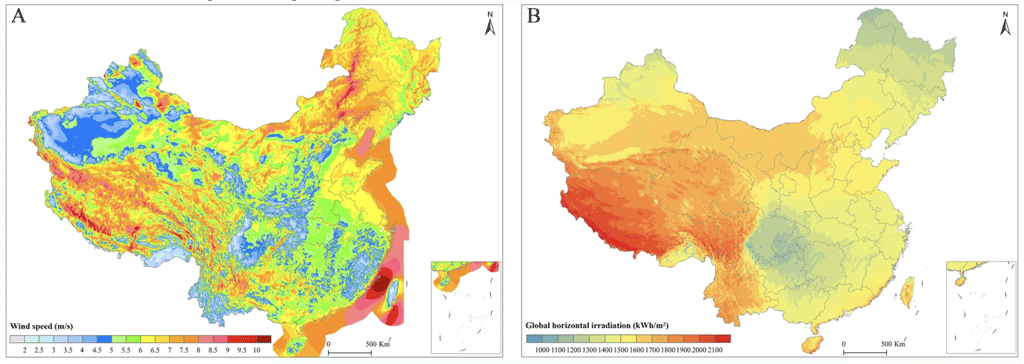
The geographical distribution of this potential is shown in the figure below, where high wind speeds (left) and high solar irradiation (right) is denoted by orange and red shading.

According to our work, the technical wind and PV power generation potential of China is 95,837TWh annually, nearly 13 times the national electricity demand of China in 2020, as shown in the table below. (This potential is also nearly four times the current global electricity demand.)
By the end of 2020, the installed capacity of wind and solar power in China represented less than 1% of its technical potential; of which wind-power installations were capable of generating 280GW, less than 2.6% of the technical potential; and PV installed capacity was 250GW, equivalent to less than 0.6% of technical potential.
China’s wind and PV power potential and electricity demand in 2020
| Regional grid | Province | Potential capacity (gigawatts) | Power potential (TWh) | Electricity consumption (TWh) |
||||||
| Wind | Onshore wind | Offshore wind (Near/Far) | PV | Central PV | Distributed PV | Wind | PV | |||
| Northeast | East Inner Mongolia | 619 | 619 | 0 | 923 | 835 | 88 | 1,744 | 1,296 | 63 |
| Heilongjiang | 706 | 706 | 0 | 301 | 149 | 152 | 1,937 | 394 | 101 | |
| Jilin | 304 | 304 | 0 | 356 | 243 | 113 | 861 | 466 | 81 | |
| Liaoning | 289 | 176 | 113 (80/33) | 191 | 17 | 174 | 777 | 238 | 242 | |
| Northwest | Gansu | 321 | 321 | 0 | 2,758 | 2,682 | 76 | 718 | 4,128 | 138 |
| Ningxia | 82 | 82 | 0 | 282 | 253 | 29 | 241 | 391 | 104 | |
| Qinghai | 186 | 186 | 0 | 3,914 | 3,886 | 28 | 379 | 6,491 | 74 | |
| Shaanxi | 165 | 165 | 0 | 372 | 298 | 75 | 448 | 458 | 174 | |
| Xinjiang | 618 | 618 | 0 | 21,198 | 21,054 | 144 | 1,293 | 29,265 | 300 | |
| North | Beijing | 0 | 0 | 0 | 61 | 2 | 59 | 0 | 72 | 114 |
| Hebei | 334 | 281 | 53 (53/0) | 338 | 59 | 279 | 988 | 587 | 393 | |
| Shandong | 596 | 296 | 300 (178/122) | 417 | 21 | 395 | 1,636 | 552 | 694 | |
| Shanxi | 127 | 127 | 0 | 311 | 194 | 117 | 364 | 439 | 234 | |
| Tianjin | 15 | 11 | 4 (4/0) | 42 | 0 | 42 | 42 | 50 | 88 | |
| West Inner Mongolia | 2,078 | 2,078 | 0 | 8,537 | 8,395 | 142 | 5,399 | 12,871 | 327 | |
| Southeast | Chongqing | 43 | 43 | 0 | 22 | 1 | 21 | 108 | 3 | 119 |
| Guizhou | 109 | 109 | 0 | 104 | 76 | 28 | 296 | 105 | 159 | |
| Sichuan | 223 | 223 | 0 | 157 | 75 | 82 | 621 | 182 | 287 | |
| Tibet | 524 | 524 | 0 | 3,332 | 3,327 | 4 | 1,375 | 6,177 | 8 | |
| South | Guangdong | 677 | 141 | 536 (220/316) | 202 | 19 | 182 | 1,977 | 257 | 693 |
| Guangxi | 250 | 181 | 69 (69/0) | 187 | 101 | 86 | 708 | 222 | 203 | |
| Hainan | 246 | 45 | 201 (41/160) | 29 | 10 | 19 | 563 | 33 | 36 | |
| Taiwan | 10 | 10 | 0 | 28 | 0 | 28 | / | / | / | |
| Hong Kong | 0 | 0 | 0 | 3 | 0 | 3 | / | / | / | |
| Yunnan | 132 | 132 | 0 | 115 | 60 | 55 | 374 | 159 | 203 | |
| Central | Henan | 291 | 291 | 0 | 303 | 14 | 289 | 869 | 377 | 339 |
| Hubei | 206 | 206 | 0 | 157 | 33 | 124 | 558 | 188 | 214 | |
| Hunan | 174 | 174 | 0 | 91 | 9 | 83 | 462 | 96 | 193 | |
| Jiangxi | 152 | 152 | 0 | 97 | 27 | 70 | 423 | 109 | 163 | |
| East | Anhui | 225 | 225 | 0 | 233 | 11 | 222 | 679 | 280 | 243 |
| Fujian | 321 | 32 | 289 (159/130) | 91 | 18 | 73 | 957 | 102 | 248 | |
| Jiangsu | 441 | 177 | 264 (242/22) | 302 | 5 | 297 | 1,200 | 372 | 637 | |
| Shanghai | 55 | 10 | 45 (36/9) | 38 | 0 | 37 | 150 | 51 | 158 | |
| Zhejiang | 429 | 50 | 379 (113/266) | 112 | 4 | 108 | 1,163 | 121 | 483 | |
| National | 10,948 | 8,694 | 2,254 | 45,604 | 41,878 | 3,726 | 29,308 | 66,529 | 7,511 | |
The technical potential of onshore wind energy in China totals about 8,690GW, with wind energy potential essentially tracking the available resources (measured at an elevation of 100 m), according to the climate data. Technical potential of onshore wind power in Northeast, Northwest, and North China (the Northern Regions) accounts for 69% of the total. Central, East and South China (Central-Southeast) account for the remaining 31%.
The technical potential of offshore wind energy resources at 100 m in China is about 2,250GW. Guangdong province has the largest technically exploitable offshore wind power, at 536GW, followed by Zhejiang, Shandong, Fujian, Jiangsu and Hainan. The technical potential of offshore wind power in each of these provinces is greater than 200GW, while that in Guangxi, Hebei, Shanghai and Tianjin is less than 100GW each.
The technical potential of centralised PV power in China is about 41,880GW, with potential again tracking the spatial pattern of solar resource endowment. The Northern Regions account for 91% of the total. Centralised PV power in Central-Southeast China accounts for the remaining 9%.
The technical potential of distributed PV power in China is about 3,730GW, with the Northern Regions accounting for 51% and the Central-Southeast area taking 49%.
Scientific foundation
Our paper provides a data-based, scientific foundation for formulating mid- and long-term renewable energy plans at the national and provincial scales.
In addition, governments at all levels can draw upon the supporting data to guide carbon peaking and neutrality schedules, roadmaps and construction plans.
Wang et al. (2022) Assessment of wind and photovoltaic power potential in China. Carbon Neutrality, doi: 10.1007/s43979-022-00020-w
-
Guest post: China’s wind and solar potential is ‘nine times’ that needed for carbon neutrality

