Guest post: China’s CO2 emissions grew less than expected in 2017
Multiple Authors
03.08.18Multiple Authors
08.03.2018 | 2:14pmChina’s CO2 emissions grew by 1.4% in 2017 after three years of staying flat or falling slightly, according to our analysis of preliminary government statistics released last month.

Although this shows emissions in China are growing again, it is a better outcome than expected.
Some analysts – including ourselves – initially projected that the growth would be as much as 3-4%. This was based on mid-year data, which showed strong growth in coal-fired power generation and energy-intensive industries, balanced with expectations that the growth would taper off later in 2017.
With a rebound in heavy industry and coal-fired power generation, Chinese coal consumption was expected to grow in 2017, after falling since 2014. Combined with continued strong growth in oil and natural gas consumption, an uptick in CO2 emissions was expected.
However, the newly released official statistics report much lower estimated growth in both coal consumption and CO2 emissions than we originally expected. As is often the case with Chinese data, the numbers pose as many questions as they answer.
Statistical communiqué
The newly released data is part of the 2017 Statistical Communiqué, a collection of preliminary statistics for 2017 from the Chinese National Bureau of Statistics (NBS) that contains data on everything from industrial production to water resources. The communiqué also contains preliminary estimates of total energy consumption and the growth rate of each fossil fuel, which allows us to calculate CO2 emissions.
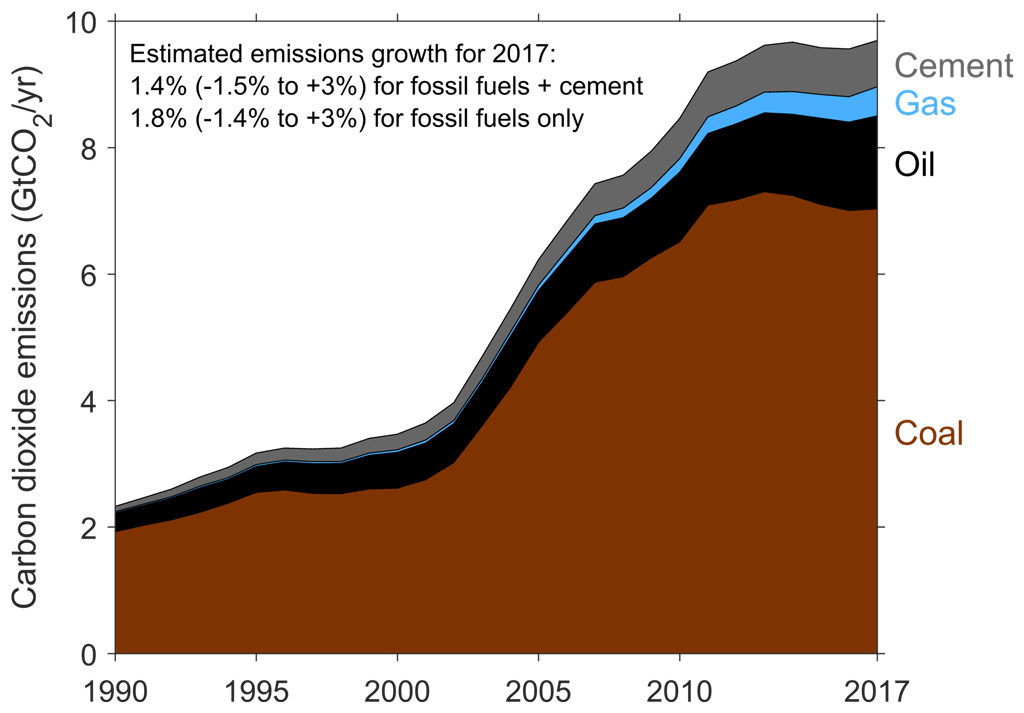
Using the new data, we estimate that total CO2 emissions from fossil fuels and cement grew by 1.4%. (Note: we follow the convention in the communiqué by not adjusting growth rates for the leap year in 2016.)
You can see this in the chart below, which shows how emissions have changed since 1990. Coal (red shading) is still what really matters for CO2 emissions in China. Coal consumption accounts for 60.4% of total energy consumption in 2017, the lowest in modern times, but still dominates CO2 emissions, comprising 78% of total emissions from fossil fuels.

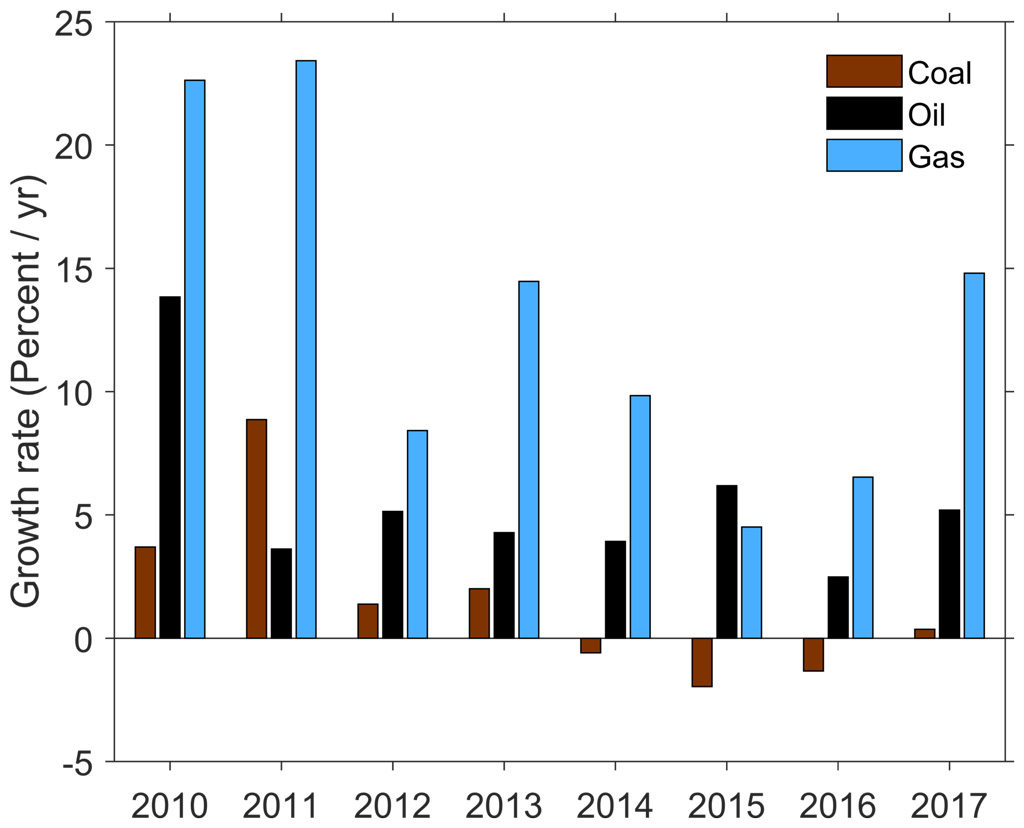
The next chart shows that coal consumption (again in red) grew only slightly last year – by 0.2-0.4% (depending on what you measure). Oil (black) and natural gas (blue) consumption, meanwhile, charged ahead – growing by 5.2% and 14.8%, respectively, and continuing the trend of the last decade.
In the three years from 2014 to 2016 when Chinese CO2 emissions stagnated or fell, moderate declines in coal consumption offset the rapid growth in oil and natural gas consumption. The slight increase in coal consumption in 2017 was enough to push total CO2 emissions up again in 2017.

For the first time, the communiqué also includes an estimate of the change in CO2 intensity relative to gross domestic product (GDP; CO2 emissions per yuan). The reported reduction in CO2 intensity (-5.1%), along with 6.9% GDP growth, implies that total CO2 emissions grew by about 1.4% – consistent with our own calculation.
The inclusion of CO2 emission intensity in the communiqué indicates that Beijing is giving ever more attention to tracking progress on its climate policies, after having pledged to reduce their CO2 intensity by 60-65% relative to 2005 levels by 2030 as part of their contribution to the Paris agreement.
Revising a projection
We initially projected Chinese CO2 emissions to grow by 3.5% for 2017 (within an uncertainty range of 0.7% to 5.4%) in the Global Carbon Budget 2017 (GCP). Those growth rates were adjusted for the leap year in 2016 and, without adjustment the growth rates, would be 0.27% lower, but are nevertheless still far more than the 1.4% in the newly published official estimate.

We projected 3.3% growth in coal consumption in 2017 (or 3% without leap-year adjustment), with a range of 0.3 to 5.3%.
The GCP estimate was made in the early autumn and published for public review in November 2017. Our estimates were based on mid-year energy and industrial statistics published between June and September, educated guesses about trends for the rest of the year, and uncertainty ranges based on data from previous years. Others arrived at similar estimates as late as January 2018.
So why did the official data from the NBS – which is preliminary and far from final – lead to estimates near the lower end of the uncertainty range in our projections?
The coal projection is clearly the key here: we obtain a total CO2 emissions growth that is very close to the NBS if we redo our calculations with their estimate of coal consumption growth.
The explanation for the gap between our central projection for coal consumption growth and NBS’s number comes in two parts: what happened in the Chinese economy during the second half of 2017; and conflicting data.
The ups and downs of 2017
The economic and political factors affecting emissions during 2017 have already been covered in a recent post by China Dialogue. Much of it was already anticipated before the latest statistics were released.
Infrastructure and real-estate investment, heavy industry output and coal-fired power generation surged from autumn 2016 through to summer 2017. This was caused by an economic stimulus after the slump in 2015-2016 – and ahead of the politically sensitive 19th Party Congress in October 2017 – along with a year-long drop in hydropower generation.
Reduced stimulus and tougher environmental measures, such as production curbs on heavy industry and bans on burning coal for heating in northern China, caused coal consumption to drop in the last few months of 2017. A rebound in hydropower generation also contributed.
Neither political signals nor expert opinion suggest that coal consumption will embark on a sustained growth trend again, even though there may be bumps before it finally starts to drop consistently and permanently sometime in the coming decade.
A decline in coal consumption growth in late 2017 was expected and we adjusted our projection to account for it. In the end, the decline in the second half of the year was somewhat greater than we anticipated.
Conflicting projections from conflicting inputs
A part of the difference with our projection was also due to conflicting mid-year data, where our projection was at the higher end of the range implied by that data.
The Chinese National Energy Agency (NEA), a government agency, estimated in July that coal consumption from January to June 2017 had grown by just 1% year-on-year. The China Coal Industry Association (CCIA), on the other hand, estimated 5% growth and that total coal consumption had been 100m tonnes higher than the NEA estimate (1.93bn vs 1.83bn tonnes).
In our projection of CO2 emissions, we gave greater weight to the CCIA estimate, because strong growth in coal-fired power generation and significant growth in coal-intensive industry sectors made the NEA estimate seem impossibly low.
We adjusted the growth rate down a little to account for an expected slowdown in late 2017, applied experience-based adjustments and uncertainty ranges, and arrived at our projection of a 3.3% increase in coal consumption for the full year, with an uncertainty range of 0.3-5.3%.
Prof Qi Ye of Tsinghua University, who is a leading expert on Chinese environmental policy and leads the Brookings-Tsinghua Center for Public Policy, criticised our use of CCIA estimates.
Qi Ye argued that the CCIA estimates are based on data mainly from large coal producers and use different methodology from the official government statistics, as well as that the NEA estimate would be more suitable for national growth projections. This may well be the case.
However, NEA’s estimate of 1% growth in coal consumption for the first half of 2017 seemed far too low to be credible. Coal-fired power generation, which accounts for 45% of coal use, grew by 7.1%, while production of coke – a carbon-rich substance used primarily in iron and steelmaking that accounts for another 15-20% of total coal use – grew by 2.5%. None of the other major coal-consuming sectors for which data was available showed significant reductions in output. The CCIA’s estimate of +5% seemed far more reasonable given the growth in coal-consuming sectors.
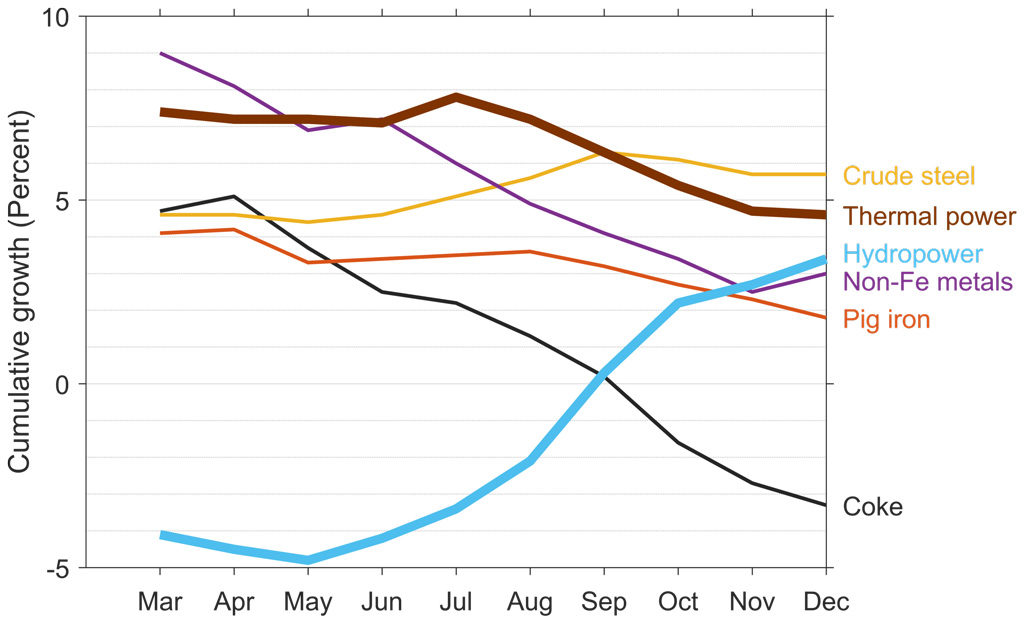
By the end of the year, however, this situation had changed. You can see how the year panned out in the chart below, which shows the cumulative year-on-year growth for different industrial products.

Coal-fired power generation (red) had grown by 4.8% by the end of the year – still sizeable, but much less than the first half. (The communiqué reported 5.1% growth for thermal power generation, but that also includes a few other minor sources, such as natural gas).
A 0.8% improvement in the average efficiency of coal-fired power plants reduced implied coal consumption growth even further.
Coke production growth had declined by 3.3%, a whopping 5 percentage points lower than the mid-year growth rate. Most other coal-intensive industrial products also declined or at least saw somewhat reduced growth rates.
Taken together, these declines are in a range where coal consumption growth as low as 0.4% is at least possible, especially given that the amount of coal used for heating in the winter season probably declined considerably due to bans on coal for heating around Beijing.
The numbers are never settled
Nevertheless, caution is advised. The numbers in the communiqué are preliminary and based on incomplete data.
The reported growth rates in oil and coal consumption are proxies that only reflect use of crude oil and coal itself. They do not consider how much of the many products that are produced from them – such as gasoline and coke – was actually consumed during 2017, nor how much was simply added to stockpiles.
The details will only become available when the full statistics are released in late 2018 or early 2019. The differences are usually small, but large enough to matter when distinguishing growth rates of one or two percent.
Furthermore, as we have pointed out before (and before, and before), Chinese coal statistics have a habit of being revised. Persistent inconsistencies are also not uncommon.
A pertinent example can be seen in the full energy statistics for 2016, published only a few months ago. In 2016, official statistics reported an astounding 9% drop in coal production, after the government imposed draconian production limits and forced mine closures to curb coal production overcapacity problems.
However, when the data for 2016 came in, reported coal consumption only fell by 3.1%. Part of the gap is explained by a surge in coal imports in addition to an unprecedented drawdown of coal stockpiles – 127m tonnes – which is probably close to half of all coal stocks in the country. Even so, apparent consumption (production, plus net imports, plus coal taken from stockpiles) supposedly fell by 4.7%, which means that the reported consumption was more than 60m tonnes higher than the amount supposedly available for consumption – equivalent to the total coal consumption of Taiwan.
There has been no official explanation or even commentary on this discrepancy, but it is obviously tempting to speculate whether the production limits gave coal producers an incentive to underreport their production.
It also creates confusion about what number to use for the 2016 baseline when calculating the 2017 growth rate. It is not inconceivable that this is some of the reason for the diverging estimates from NEA and the CCIA. Also, it invites speculation about whether the strict anti-pollution measures and bans on coal-fired heating in late 2017 have given coal-consuming industries an incentive to underreport their consumption.
Have emissions peaked?
Still, the good news is that, as Qi Ye pointed out, even if Chinese coal consumption had grown by a rate closer to our original projection, it would still be below the peak year 2013. But because of sustained growth in oil and gas, it is still too early to say if CO2 emissions have peaked.
Furthermore, even if coal consumption is being underreported and the presumed downwards trend starting in late Autumn 2017 is not as pronounced as is widely assumed, the policy signals suggest the trend will continue downwards.
The slight uptick in coal and CO2 emissions in 2017 are likely to be bumps in the road as long as the Chinese central and provincial governments stick to their current policy course and avoid hitting the stimulus panic button when heavy industries show lagging growth.
We expect future data to show both ups and downs in Chinese emissions. But occasional moderate increases in coal consumption and emissions do not change the likely long-term decline of Chinese coal consumption and CO2 emissions.

