Guest post: Air pollution and irrigation mask extremes of India’s 2019 heatwave

Multiple authors
06.21.19
Multiple authors
21.06.2019 | 3:25pmDr Geert Jan van Oldenborgh, Dr Gabriel Vecchi, Dr Flavio Lehner, Dr Friederike Otto, Dr Karsten Haustein, Dr Claudia Tebaldi, Dr Maarten van Aalst and Dr Krishna AchutaRao are from the World Weather Attribution collaboration.
India is currently suffering one of the longest heatwaves in its recent history. Northern and central parts of the country have seen intense heat for more than 30 consecutive days, with temperatures in New Delhi topping 48C – the highest ever recorded in the capital in June.
Such an extended period of ferocious heat has been deadly. In the eastern state of Bihar, for example, 180 people have so far died, with hospitals “inundated with people suffering from heatstroke”.
The extreme weather follows in the footsteps of a lethal heatwave in 2016, when India recorded its highest-ever temperature of 51C in the western state of Rajasthan – one of the hottest temperatures ever recorded on earth.
Globally, the frequency and intensity of heatwaves are generally rising due to climate change. However, we do not yet see a clear upward trend in extreme temperatures in India.
A complex mix of competing human impacts means that, despite rising average temperatures, maximum temperatures have not risen in tandem. This article looks at the data, explains the (lack of a) trend and looks at the rising risks in store for the future.
Defining a heatwave
For India, May to June is typically the hottest period of the year, with temperatures often reaching up to 40C in the hottest areas before the cooling southwest monsoon rains arrive in July.
However, this year was worse than usual. As the map below shows, maximum temperatures reached well above 40C across most of India – and even into Pakistan.
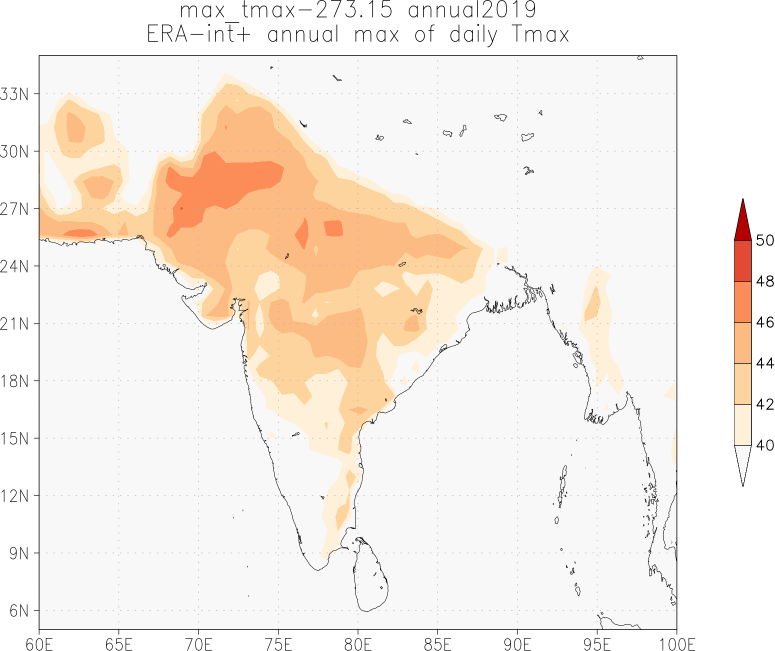
Map showing highest daily maximum temperature of the year 2019, based on data from ECMWF operational analyses and forecasts up to 27 June 2019. Red shading indicates the hottest temperatures, note that the colours start at 40C. Produced by Geert Jan Oldenborgh via the KNMI Climate Explorer.
Although it is easy to define and monitor when and where local record temperatures are broken, a heatwave is less straightforward as there are different metrics available.
Focusing on the one-day maximum temperature can be most relevant for rural outdoor workers, who are among the most vulnerable to heatwaves in India. A focus on longer durations, say three days, may better capture the impacts on urban populations and indoor workers. There are also heatwave indices that account for factors beyond temperature, notably humidity, which is known to play an important role in how heat impacts the human body.
Nevertheless, in a warming climate we expect heat records to be broken more frequently and for heatwaves to become more intense. We see this in many parts of the world, with rising intensity and frequency of heatwaves attributed to human-caused climate change.
This includes the famous 2003 heatwave in Europe, responsible for more than 70,000 deaths, which was the first event where scientists were able to identify a human influence. The likelihood of this event had more than doubled due to climate change. (It has continued to increase since then.)
While it might be expected that the dominant impact of global warming would extend to India, there are a number of other important factors that affect maximum temperatures locally.
Worsening air pollution blocks more and more sunlight and, thus, decreases maximum temperatures. In addition, increasing irrigation means that more of the heat is used to evaporate water and less to warm the air.
Finally, while in many big cities the “urban heat island” effect leads to hotter heat waves, some cities in the dry north of India actually show an “urban cool island” effect driven by higher water usage compared to the surrounding arid land areas.
Taken together, these factors play as large a role as global warming and counteract the expected upward trend in heatwaves – at least for now.
Competing impacts
To investigate how all these factors affect heatwaves we need reliable observations. For India, these are not easy to obtain.
Publicly accessible global datasets often have large amounts of missing data over India. Worse, the amount of missing data in the 1970s was so high that many heatwaves were likely not recorded in those years. This leads to an artificial upward trend after the 1970s as the number and quality of weather measurements improved.
An alternative option is to use temperature records based on a combination of direct measurements and a weather model – an approach known as “reanalysis”. While these are not perfect, they are presently the best publicly available basis to study real-world occurrences of heatwaves.
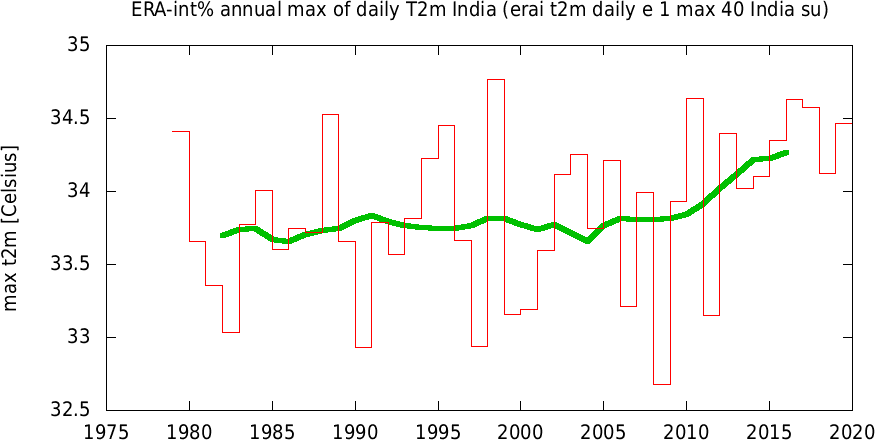
Analysing both the observations (corrected for missing data) and reanalyses, we find no trend in the highest maximum temperatures of the year over most of India since the 1970s. This holds for heatwave definitions from single hot days to weekly averages and even for the monthly average of maximum temperatures in May and June.
The chart below shows the highest daily maximum temperature of the year, as an average over India, over the past 40 years (red line). The green line shows a slightly declining trend over that time.
Overall, maximum temperatures in the hottest months do not tend to show an increasing trend across India. Instead, the high temperatures of 2019 seem due to the natural year-to-year variability of the weather.
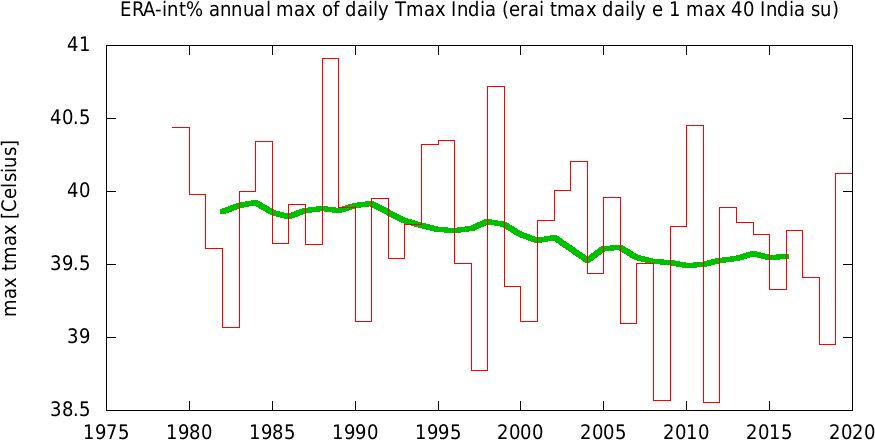
Average over India of the highest daily maximum temperature of the year (ERA-interim extended with operational analyses and forecasts up to 30 June 2019). Produced by Geert Jan Oldenborgh.
Our analysis suggests that the combination of increased air pollution and irrigation have more or less offset the warming from increased greenhouse gases.
So, how do we know this?
Well, while maximum temperatures have not increased, minimum temperatures have. As daily minimum temperatures typically occur at night, they are much less affected by air pollution (which primarily affects incoming solar radiation).
And, indeed, we see that the hottest nights of the year have increased since the 1970s over large parts of India. This means that, overall, average temperatures have continued to rise. The chart below shows the highest daily average temperatures averaged over India for the past 40 years (red line). The green line shows a small increasing trend.
Average over India of the highest daily average temperature of the year (ERA-interim extended with operational analyses and forecasts up to 27 June 2019). Produced by Geert Jan Oldenborgh via the KNMI Climate Explorer.
In addition, relative humidity in May has increased strongly since the 1970s, probably due in part to irrigation. Therefore, despite the fact that there is no clear increase in maximum temperature extremes, heat indices that take humidity into account do show upward trends: heatwaves have become more humid, posing greater risk to human health. Increased air pollution also substantially increases the negative health impacts of heatwaves, but as far as we know this has not yet been quantified.
The conclusion is that the meteorological heatwaves described by the highest one-day – and multiple-day – maximum temperature trends have not increased in intensity over India since the 1970s, contrary to most of the rest of the world.
And, so, while the current heat in 2019 is more severe than in the last few years, this is not yet part of a clear systematic trend. But health impacts of heatwaves have been getting more severe due to higher humidity and more air pollution.
Expected trends
For the future, we expect that a clear signal of human-caused climate change to emerge in maximum temperatures as measures are put in place in India to improve air quality.
A similar effect was seen in western Europe where summers only became hotter from the mid-1980s onwards when emission of pollutants was successfully regulated and reduced.
In addition, with expanding groundwater depletion, keeping up the present-day irrigation rates could prove challenging for parts of India. Thus, both factors currently counteracting the impacts of global warming on Indian heat extremes are likely to change.
Given that greenhouse gas concentrations continue to increase, we expect to see an amplified upward trend in heatwaves in the not too distant future.
It is important to note that climate models typically do not include the effects of irrigation and are sometimes limited in how they represent air pollution. More research – including better model representation of these factors – is, therefore, needed to better quantify the different drivers of heat extremes and more reliably assess future heatwave risks.
Adaptation
The impacts of heatwaves also strongly depend on vulnerability and exposure of people and the systems they rely on.
On the one hand, these factors can also contribute to the rising risk of heatwaves, but they may also offer opportunities to better manage those risks, even in the face of increasing heat.
The extent to which people have to work outside and the availability of clean water – and sometimes even air-conditioning – can make an immense difference for reducing heat deaths and hospital admissions.
Advice to vulnerable groups on behaviour during periods of heat – such as drinking enough water – and sometimes even government regulation – for instance, prohibiting outside labour during the hottest hours – can also have an enormous impact. Over the longer run, urban design, including housing but also urban green space, also needs to take more account of rising heat risks.
In France, the “Plan Canicule” initiated after the deadly 2003 heatwave has very significantly reduced excess deaths in similar heatwaves, In India, the “Heat Action Plan” implemented in the city of Ahmedabad have been shown to have drastically reduced mortality during the heatwave of 2015. Yet many cities do not yet have such plans and many countries don’t even have heatwave early warnings, despite excellent predictability and the rising risks.
In the long-term, the projected increases in heat and humidity will require much more efforts to better manage the rising risk of heatwaves. If global warming continues unabated, it could challenge the ability for humans, livestock and wildlife to survive outdoors in parts of India.
-
Guest post: Air pollution and irrigation mask extremes of India’s 2019 heatwave
-
Guest post: The complex human impacts behind India’s 2019 heatwave


