‘Food miles’ have larger climate impact than thought, study suggests
Ayesha Tandon
06.20.22Ayesha Tandon
20.06.2022 | 4:17pmGlobal “food miles” emissions are higher than previously thought – accounting for nearly one-fifth of total food-system emissions – new research suggests.
The study, published in Nature Food, estimates the carbon footprint of the global food transport system. The authors assess the entire food supply chain – considering emissions from transporting fertilisers, machinery and animal feed as well as from moving the food itself.
They find that in a single year, global food miles were responsible for 3bn tonnes of CO2 equivalent emissions – 3.5-7.5 times larger than previous estimates.
“Food-miles emissions are driven by the affluent world,” the study says. It finds that while “high income nations” represent only about 12.5% of the world’s population, they are responsible for 52% of international food miles and 46% of the associated emissions.
The authors also reflect on the pros and cons of buying local food – an often-touted solution for reducing food emissions. The study showed that ending all international food transport would cut food-miles emissions by just 9%, highlighting the relatively greater importance of other dietary choices in tackling the climate impact of the sector.
As such, the lead author of the study tells Carbon Brief that while eating local does reduce emissions, this should be paired with eating seasonal produce and reducing meat consumption to limit dietary emissions.
This study presents “a significant deviation from the former scientific mainstream opinion that transport is no major contributor to emissions from the food system”, a scientist not involved in the research tells Carbon Brief. However, he adds that he would “interpret the results with caution”, as emissions may be overestimated in places.
The paper has triggered debate over the definition of the term “food miles”, which typically considers the distance from where the food is produced to where it is consumed, rather than encompassing the entire food supply chain.
‘Food miles emissions’
Feeding the world is an expensive undertaking. Food production uses up half of the Earth’s habitable land, and “food systems” – a catch-all term to describe the way humans produce, process, transport and consume food – are responsible for one third of all human-caused emissions.
Past studies suggest that transporting food has a small carbon footprint when compared to the rest of the food system. However, many do not to account for emissions throughout the entire food supply chain. The new study aims to fill this gap and includes emissions from transporting fertilisers, machinery and animal feed as well as the more obvious shipping and vehicle emissions from sending food products around the world.
The authors consider 74 regions, 37 economic sectors such as chemicals and machinery, and four transportation modes. They then use a “multi-region input–output model” to assess the emissions produced by transporting food and other components of the food system across the entire supply chain. This is referred to as “food-system miles”.
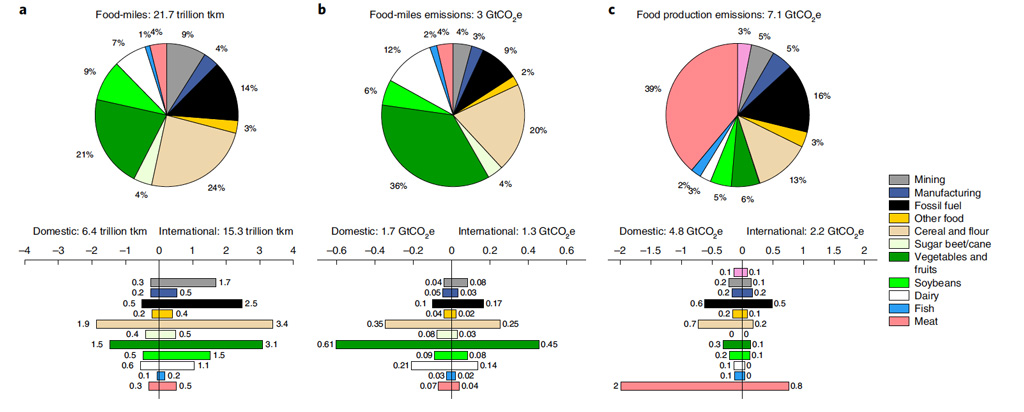
The plot below shows total food-system miles in “tonne-kilometres”, indicating the distance travelled per tonne of food, on the left. The central figures show the resulting emissions. And total food system emissions, including emissions from land-use change, food production, transportation and consumption, are shown on the right.
Each graphic is split into sectors, including components of the food system such as meat (pink), and dairy (white), as well as related sectors such as manufacturing (dark blue). The bottom panel splits each component into “domestic” (left of the zero line) and “international” (right) emissions and miles travelled.

Maintaining the current global food system requires food and related equipment to be transported a total of 22tn “tonne-kilometres” per year, according to the study. This drives 3bn tonnes of CO2 equivalent (CO2e), accounting for almost one-fifth of total food system emissions, it finds.
Dr Ulrich Kreidenweis – a researcher at the Leibniz Institute of Agricultural Engineering and Bio-economy, who was not involved in the study – tells Carbon Brief that the new study presents “a significant deviation from the former scientific mainstream opinion that transport is no major contributor to emissions from the food system”.
For example, a study published last year finds that transport is responsible for only 4.8% of total food system emissions. However, this study includes refrigeration separately, stating that the “cold chain” of keeping food in a temperature-controlled environment throughout transit and sales accounts for 5% of global food system emissions.
“Investigating transportation emissions along the whole global food supply chain is an important step in understanding food-mile emissions”, adds Dr Paul Behrens, an assistant professor at Leiden University, who was also not involved in the paper. He tells Carbon Brief that this paper presents “the first estimate of its kind”.
It is well known that meat production is highly carbon intensive, requiring extensive stretches of land for rearing livestock and producing animal feed. As expected, the plot from the study shows that meat is responsible for almost two-fifths of total food system emissions – far outstripping any other food type. However, meat accounts for only 4% of all food transport emissions.
Meanwhile, fruits and vegetables are responsible for one-fifth of global food miles, but account for over one-third of transport emissions. This is because fruits and vegetables require energy-intensive refrigeration throughout their journey, and weigh a lot compared to other food types, the study explains.
Global supply chain
The global food system is complex and interlinked. Producing red meat consumed in China, for example, can involve production steps from almost every continent on the planet.
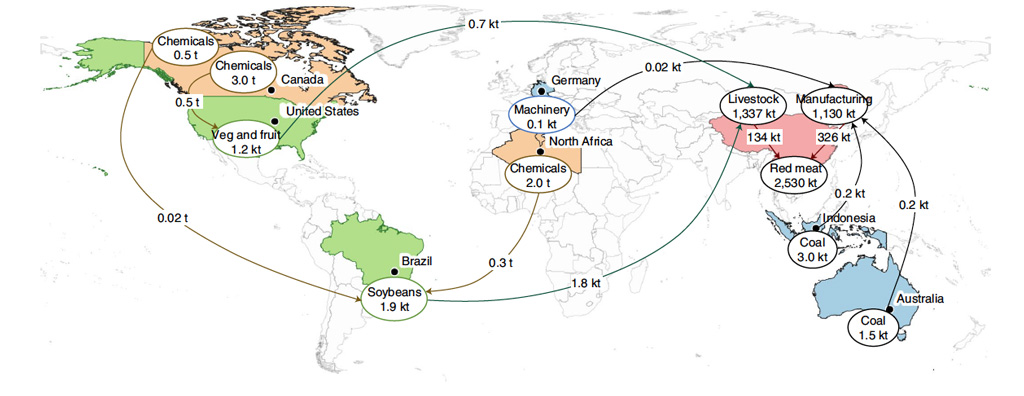
The plot below shows an example of these steps, including machinery, manufacturing and the chemicals required to produce animal feed. Bubbles present food production emissions, while arrows represent the food-miles emissions.

To produce red meat for consumption in China, chemicals from Canada are sent to the US by road to grow fruits and vegetables, and to Brazil by ship to grow soybeans. These are used to feed livestock in China. Meanwhile, coal imported from Australia and Indonesia is used for manufacturing, along with machinery from Germany.
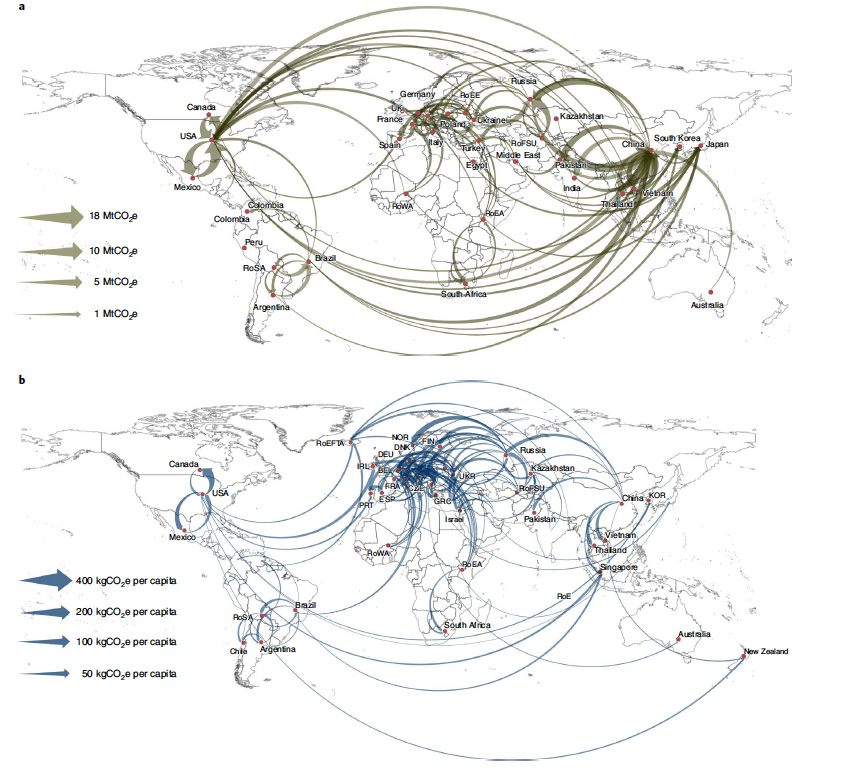
To map food-mile flows across the entire global supply-chain network, the authors were required to model more than 30m direct trade connections. The plot below shows the top 100 bilateral flows – from one country to another – of international food-miles emissions (top) and the same per person (bottom). Thicker arrows indicate greater emissions.

The plot highlights some of the hotspots of trading activity in certain regions – for example, in Europe and China – while others see less traffic. Most notable is the lack of trading with countries in Africa.
“Food-miles emissions are driven by the affluent world,” the study states. The authors find that high-income countries – where per-capita GDP is above US$25,000 – represent only about 12.5% of the world’s population, but drive around half of international food miles and emissions.
Meanwhile, representing about half of the global population, low-income countries with per-capita GDP below US$3,000 are responsible for only 12% and 20% of international food miles and emissions, respectively, the study finds. It adds:
“High-income regions, including Oceania, Europe and North America, clock up per-capita food miles and emissions 2.7–2.8 times that of other aggregated broad regions.”
Dr Mengyu Li from the University of Sydney is the lead author of the study. She explains that high per-capita emissions in rich counties are in part due to the wide choice of food available there. For example, she notes “the year-round habit of consumers in rich countries for non-seasonal food products that need to be shipped from elsewhere” – which is less prevalent in poorer countries.
Meanwhile, countries with high populations and large land areas generally have the highest domestic emissions, the study finds. It notes that two-thirds of domestic emissions come from China, India, the US and Russia.
Buying local
Buying locally sourced food is often touted as an easy way to reduce dietary emissions. However, the paper finds that while international transport drives 71% of food miles, domestic transport emissions are 1.3 times higher overall. This is because 93% of international food transport relies on shipping, which has a relatively low carbon intensity, the study says, while 94% of domestic transportation is caused by more polluting road transport. Meanwhile, the authors find that less than 0.25% of “freight tasks” moved by air.
Nevertheless, switching to a local diet can still reduce emissions – especially in richer countries. The authors found that if the entire world were to switch to a purely domestic food supply, food-miles emissions would be reduced by a modest 0.27bn tonnes of CO2 equivalent. They add that 0.24bn tonnes of this would come from high-income countries.
Carbon Brief asked lead author Li whether eating local is still a useful way to combat food emissions. She says that “localising food supply still leads to emissions reductions”, but adds:
“For consumers, in addition to shifting towards a plant-based diet, eating local seasonal alternatives is ideal, especially among affluent countries.”
The paper “really emphasises the importance of electrifying goods vehicles, switching to rail and/or moving food production closer to population centres,” Behrens tells Carbon Brief. He adds that the paper “combines an impressive set of different data sources in a novel way”.
However, Kreidenweis says that he “would interpret the results with caution”, as the authors “have taken several decisions that may lead to a strong overestimation of food-miles emissions”. For example, he says that the mass of food transported and emissions from some modes of transport may be overestimated.
For example, he says, the study assumes that 99.4% of domestic coal transport happens by road, whereas in reality, trains transport nearly 70% of coal deliveries in the US at least part of the way from mines to consumer.
Li et al (2022), Nature Food. Global food-miles account for nearly 20% of total food-systems emissions. doi:10.1038/s43016-022-00531-w
Update: This piece was updated on 24/06/2022 to include a line on the debate around the term “food miles” that the paper has triggered.

