The rapid increase in UK solar power capacity will help the electricity grid to experience record lows in peak demand this summer, the National Grid says.
Its 2015 summer outlook report, published yesterday, describes the changes and challenges that can be expected for gas and electricity networks this year. Its sister publication, the winter outlook, tends to attract more headlines.
But the latest report is full of fascinating insights into how the UK’s relationship with electricity is changing as part of efforts to tackle climate change. Here are five things we learned from the summer outlook.
The solar surge is driving demand off grid
National Grid says the UK’s embedded solar power capacity has almost doubled in the past 12 months, from 2.4 gigawatts in February 2014 to 4.4 gigawatts a year later. The solar surge has been driven by falling module prices and a rush to install solar farms before a change to subsidy rules kicked in earlier this month.
Embedded solar capacity is not connected to the national electricity transmission grid. The amount of electricity this capacity supplies is not measured directly by National Grid, but it shows up indirectly as reduced demand.
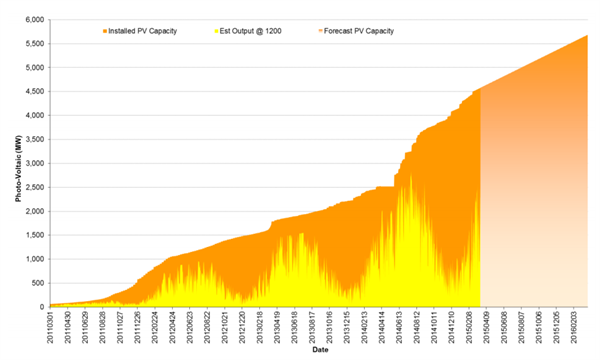
This demand-reduction effect is growing as solar capacity expands (orange areas, below). The impact is greatest around midday in the summer months, when solar electricity output (yellow areas) approaches installed capacity.
UK embedded solar capacity, which is not directly connected to the national transmission grid (orange) and its monthly electricity output (yellow). The chart shows capacity increasing from near zero in 2011 to more than four gigawatts today. Source: National Grid summer outlook.
In summer months, peak electricity demand occurs between midday and mid-afternoon, coinciding with peak output from solar cells. This is in contrast to the winter months, when demand peaks as daylight fades in the early evening and solar generation is pretty limited.
So peak summer electricity demand on the grid is expected to reach just 37.4 gigawatts this year, the outlook says, down from 38.4 gigawatts in 2013. This is the lowest ever predicted by National Grid, and it says the record low is “in large part” due to solar. The effect will increase next year as embedded solar capacity grows to an expected 5.5 gigawatts in February 2016.
Overall, UK solar capacity reached 5.2 gigawatts at the end of 2014, according to figures published separately on Thursday by the Department for Energy and Climate Change (DECC). The figures show renewables generated 19.2% of UK supplies in 2014, with solar contributing 1.2%. This was double the solar contribution in 2013.
Electricity demand is falling despite economic growth
Embedded solar isn’t the only thing reducing grid electricity demand. Total demand continues to fall, National Grid says (red and blue lines, below), even as the economy has expanded since the recession (pink line).
Changes in UK electricity demand and GDP since 2005. The solid red and blue lines smooth out the effects of the weather and seasons. Demand has continued to fall after the one-off impact of the global financial crisis. Source: National Grid summer outlook.
Carbon Brief looked at the reasons behind falling domestic electricity demand last summer. This accounts for around a third of the UK total, with business, industry and the public sector making up the remainder, and similar factors are reducing demand across the board.
The summer outlook report points to the rise of energy-efficient lighting and appliances, along with behaviour change. It says demand is expected to keep on falling – though this could start to change if electric vehicles and electric heating take off during the next decade.
Wind farms are twice as productive in winter
Wind capacity is also increasing in the UK, with the latest DECC figures showing capacity was up 14% in the last year to 12.8 gigawatts. Onshore and offshore windfarms together generated nearly 9% of UK electricity in 2014.
But the summer outlook report shows these windfarms are most productive in winter, when it tends to be windiest (yellow, orange and red areas, below). Usefully, that’s when electricity demand is highest, too.
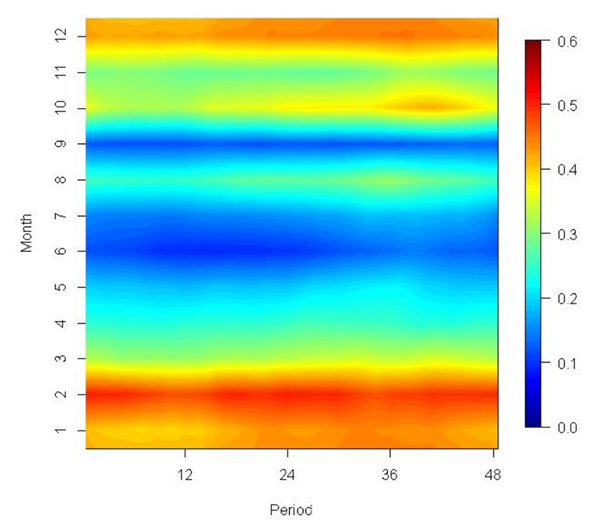
UK windfarm 2014 load factors, their output relative to installed capacity. The scale ranges from zero, when the wind isn’t blowing (blue), up to a factor of 0.6 (dark red). The time of day is shown on the x axis and the time of year on the y axis. Source: National Grid summer outlook.
The winter months of 2014 were particularly windy. Load factors averaged 0.45, meaning windfarm output averaged 45% of installed capacity. This compares to an average of 30% during the winters of 2011 to 2013. Summer load factors are lower, at around 16-18%, so UK windfarms are around twice as productive in winter.
Coal and gas prices are finely balanced
The summer outlook was published just days after the UK’s carbon floor price doubled to £18 per tonne of carbon dioxide. This tax on emissions disproportionately penalises coal-fired power stations compared to gas, because they emit around twice as much carbon per unit of electricity.
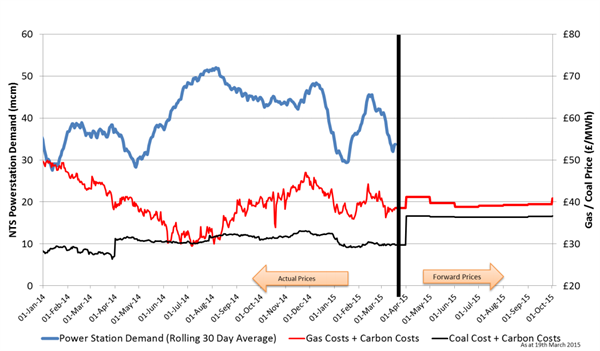
The doubling could trigger coal-to-gas switching by generating firms, according to some analysts. But National Grid says it will remain more expensive to generate electricity with gas this summer (red line, below), despite the 1 April increase in the carbon floor price penalising coal (black line).
Cost of generating UK electricity from coal (black line) and gas (red) since the start of 2014. The effect of an increasing carbon floor price are clearly visible in April 2014 and 2015. Source: National Grid summer outlook.
It’s hard to predict the future of energy, even a few months ahead, so the summer outlook report says its projection has “considerable uncertainty”. It says coal and gas costs “are very close and it would only take a small change in either to increase the level of competition between them”.
It’s worth noting, too, that there isn’t a price trigger point where all coal plants switch off in favour of gas. There’s a wide range of relative costs depending on the efficiency of each individual station and the price it must pay to access grid infrastructure, which varies according to location.
The cost of coal- versus gas-fired electricity strongly affects UK emissions, which fell by nearly 10% last year. This was partly as a result of coal-to-gas switching, which happened last summer, even though the chart above shows fleet-average coal- and gas-fired generation cost similar amounts at the time.
Andy Murray’s Wimbledon win loses to Wills and Kate wedding
Even if we can’t expect a summer reduction in carbon emissions this year, there’s always Wimbledon to look forward to. The summer outlook shows how major TV events can temporarily reduce electricity demand, when the nation is collectively glued to the screen.
The chart below shows the ups and downs of Andy Murray’s 2013 Wimbledon victory against Novak Djokovic and its corresponding demand-reducing powers (red line, below).
Timeline of UK electricity demand during the 2013 men’s Wimbledon final (red line) compared to demand a week earlier (blue line). Source: National Grid summer outlook.
The impressive 1.6 gigawatt dent in demand during Murray’s winning moments took 25 minutes to rebound. The largest ‘TV pickup’ – a sudden jump in demand as watchers flush loos, switch on kettles or open fridges – was 0.6 gigawatts at the end of the winner’s presentation.
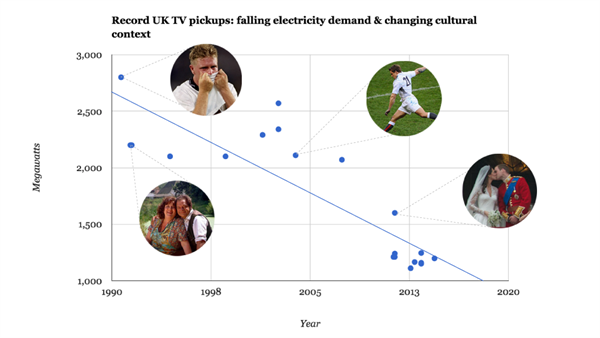
Murray is eclipsed by the 2011 wedding of Prince William and Kate Middleton which caused a 1.6 gigawatt TV pickup, the largest since 2010. Neither make the all-tie top 10, which reflects overall falling demand and changing TV viewing habits with all but one of the top entries more than a decade old. The list is topped by England’s 1990 world cup semi-final loss to Germany, at 2.8 gigawatts.
Record UK TV pick-ups plotted according to the size of pick-up in megawatts and the date. There seems to have been a decline in pick-up size since the heights of the 1990s, perhaps because of more energy efficient appliances and smaller TV viewing figures. Source: National Grid summer outlook. Chart by Carbon Brief.
Conclusion
The way the UK uses and generates electricity is in the midst of huge change as it moves from a system fuelled mainly by coal, gas and nuclear to one with a significant and growing share of renewables.
Despite falling demand, there’s also a pressing need to replace aging electricity infrastructure. The summer outlook offers reassurance that the UK will have adequate generation capacity for the coming season, but there are big challenges ahead – and not just for Andy Murray.


