
Factcheck: How electric vehicles help to tackle climate change
Zeke Hausfather
05.13.19Zeke Hausfather
13.05.2019 | 5:01pmUpdate 7/2/2020: The lifecycle emissions figures were revised to reflect more recent data on electricity carbon intensity and battery manufacture.
Electric vehicles (EVs) are an important part of meeting global goals on climate change. They feature prominently in mitigation pathways that limit warming to well-below 2C or 1.5C, which would be inline with the Paris Agreement’s targets.
However, while no greenhouse gas emissions directly come from EVs, they run on electricity that is, in large part, still produced from fossil fuels in many parts of the world. Energy is also used to manufacture the vehicle – and, in particular, the battery.
Here, in response to recent misleading media reports on the topic, Carbon Brief provides a detailed look at the climate impacts of EVs. In this analysis, Carbon Brief finds:
- EVs are responsible for considerably lower emissions over their lifetime than conventional (internal combustion engine) vehicles across Europe as a whole.
- In countries with coal-intensive electricity generation, the benefits of EVs are smaller and they can have similar lifetime emissions to the most efficient conventional vehicles – such as hybrid-electric models.
- However, as countries decarbonise electricity generation to meet their climate targets, driving emissions will fall for existing EVs and manufacturing emissions will fall for new EVs.
- Comparisons between electric vehicles and conventional vehicles are complex. They depend on the size of the vehicles, the accuracy of the fuel-economy estimates used, how electricity emissions are calculated, what driving patterns are assumed, and even the weather in regions where the vehicles are used. There is no single estimate that applies everywhere.
There are also large uncertainties around the emissions associated with electric vehicle battery production, with different studies producing widely differing numbers. As battery prices fall and vehicle manufacturers start including larger batteries with longer driving ranges, battery production emissions can have a larger impact on the climate benefits of electric vehicles.
Around half of the emissions from battery production come from the electricity used in manufacturing and assembling the batteries. Producing batteries in regions with relatively low-carbon electricity or in factories powered by renewable energy, as will be the case for the batteries used in the best-selling Tesla Model 3, can substantially reduce battery emissions.
Different studies find different results
A recent working paper from a group of German researchers at the thinktank Institute for Economic Research (ifo) found that “electric vehicles will barely help cut CO2 emissions in Germany over the coming years”. It suggests that, in Germany, “the CO2 emissions of battery-electric vehicles are, in the best case, slightly higher than those of a diesel engine”.
This study was picked up in the international media, with the Wall Street Journal running an editorial titled, “Germany’s dirty green cars”. It also engendered pushback from electric vehicle advocates, with articles in Jalopnik and Autoblog, as well as individual researchers rebutting the claim.
Other recent studies of electric cars in Germany have reached the opposite conclusion. One study found that emissions from EVs have emissions up to 43% lower than diesel vehicles. Another detailed that “in all cases examined, electric cars have lower lifetime climate impacts than those with internal combustion engines”.
These differences arise from the assumptions used by researchers. As Prof Jeremy Michalek, director of the Vehicle Electrification Group at Carnegie Mellon University, tells Carbon Brief, “which technology comes out on top depends on a lot of things”. These include which specific vehicles are being compared, what electricity grid mix is assumed, if marginal or average electricity emissions are used, what driving patterns are assumed, and even the weather.
The figure below, adapted from an analysis by the International Council for Clean Transportation (ICCT), shows an estimate of lifecycle emissions for a typical European conventional (internal combustion engine) car, the hybrid conventional car with the best available fuel economy (a 2019 Toyota Prius Eco), and a Nissan Leaf electric vehicle for various countries, as well as the EU average. [The Leaf was the top selling EV in Europe in 2018.]
The chart includes tailpipe emissions (grey), emissions from the fuel cycle (orange) – which includes oil production, transport, refining, and electricity generation – emissions from manufacturing the non-battery components of the vehicle (dark blue) and a conservative estimate of emissions from manufacturing the battery (light blue).
In most countries, the majority of emissions over the lifetime of both electric and conventional vehicles come from vehicle operation – tailpipe and fuel cycle – rather than vehicle manufacture. The exception is in countries – Norway or France, for example – where nearly all electricity comes from near-zero carbon sources, such as hydroelectric or nuclear power.
However, while the carbon emitted from burning a gallon of petrol or diesel cannot be reduced, the same is not true for electricity. Lifecycle emissions for electric vehicles are much smaller in countries such as France (which gets most of its electricity from nuclear) or Norway (from renewables).
The chart above bases electric-vehicle emissions on the current grid mix in each country. However, if the climate targets set in the Paris Agreement are to be met, electricity generation will become significantly less carbon-intensive, further increasing the advantage of electric vehicles over conventional ones.
For example, in the UK, emissions from electricity generation have fallen 38% in just the past three years and are expected to fall by more than 70% by the mid-to-late 2020s, which is well within the lifetime of electric vehicles purchased today.
Emissions associated with battery production are taken from the most recent (2019) estimate from the IVL Swedish Environmental Research Institute. The Nissan Leaf analysed here has a 40 kilowatt hour (kWh) battery, while the Tesla Model 3 has both 50kWh or 75kWh options (a 62kWh option was previously available, but has been discontinued).
The figure below shows the estimated lifecycle emissions from a Model 3 if the battery were produced in Asia – which has a large portion of its electricity generated from coal – as is the case for Nissan Leaf batteries. The long-range 75kWh model is used for this analysis, to mimic the approach in the ifo study; battery-manufacturing emissions from the mid-range 50kWh model would be around a third smaller.
Under these assumptions, a Tesla Model 3 would have higher lifecycle greenhouse gas emissions than the best-rated conventional car in Germany, but would still be better for the climate than the average vehicle. In other countries even a long-range Tesla Model 3 would be more lower emissions than any petrol vehicle.
However, the fact that the Tesla batteries are, in fact, manufactured in Nevada makes an important difference to this calculation. Lifecycle emissions estimates for batteries produced in the US tend to be notably lower than those produced in Asia, as discussed later in this article.
Around 50% of the battery lifecycle emissions come from the electricity used in battery manufacture and assembly, so producing batteries in a plant powered by renewable energy – as will be the case for the Tesla factory – substantially reduces lifetime emissions. The figure below shows Carbon Brief’s estimate of lifecycle emissions from a Tesla Model 3 with batteries produced in the Tesla “Gigafactory”.
Taking manufacturing conditions into account, a Model 3 with a 75kWh battery from the Nevada Gigafactory results in notably smaller emissions – and has a lifecycle climate impact similar to the estimate for the Nissan Leaf.
Emissions from electricity generation will also vary within countries, with some regions having much cleaner generation mixes (and correspondingly larger climate advantages for EVs) than others.
The figures shown above adjust emissions for both conventional and electric vehicles to reflect real-world driving conditions rather than test-cycle numbers. This is important, as official fuel economy estimates can differ widely from real-world performance, with large knock-on impacts for the comparison between conventional and electric vehicles.
Paying back the carbon debt
The analysis in the figures above compares EVs and conventional vehicles over their entire lifetime, based on a total of 150,000km of driving.
However, it’s also possible to compare the vehicles over time, to see how long it would take to repay the initial “carbon debt” incurred by the production of a carbon-intensive battery pack for EVs.
For example, as already noted above, a new Nissan Leaf EV bought in the UK in 2019 would have lifetime emissions some three times lower than the average new conventional car.
Looking at this over time, in the figure below, shows that while the battery causes higher emissions during vehicle manufacture in “year zero”, this excess carbon debt would be paid back after less than two years of driving.
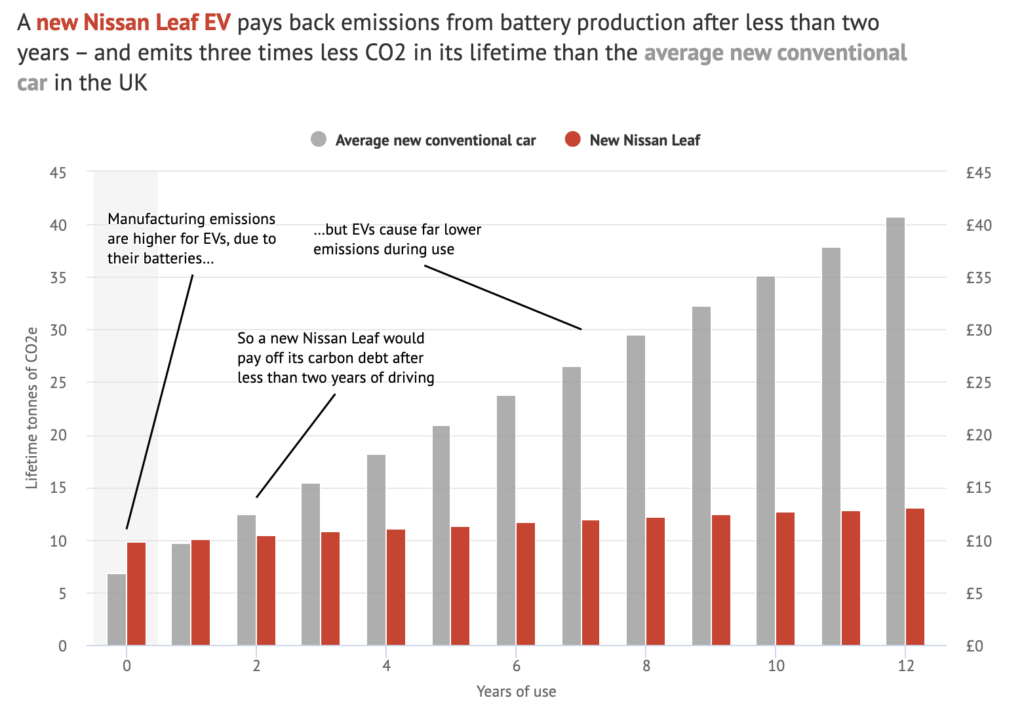
Cumulative greenhouse gas emissions for an average new conventional car versus a new Nissan Leaf. Figures are in lifetime tonnes of CO2-equivalent, assuming 150,000 kilometres driven over a 12-year lifetime. EV fuel cycle emissions based on the UK electricity carbon intensity in 2019 for year one and gradual improvement towards a 2030 target of 100gCO2/kWh and beyond. Chart by Carbon Brief using Highcharts.
The chart above shows that the difference in use-phase emissions is relatively large, with the EV saving some two to three tonnes of CO2 equivalent each year in the UK. (The figure falls over time as the electricity mix gets cleaner).
This means that even if a new EV replaces an existing conventional car, it would still start to cut emissions after less than four years of use compared to continuing to run the older vehicle, as shown in the chart below.
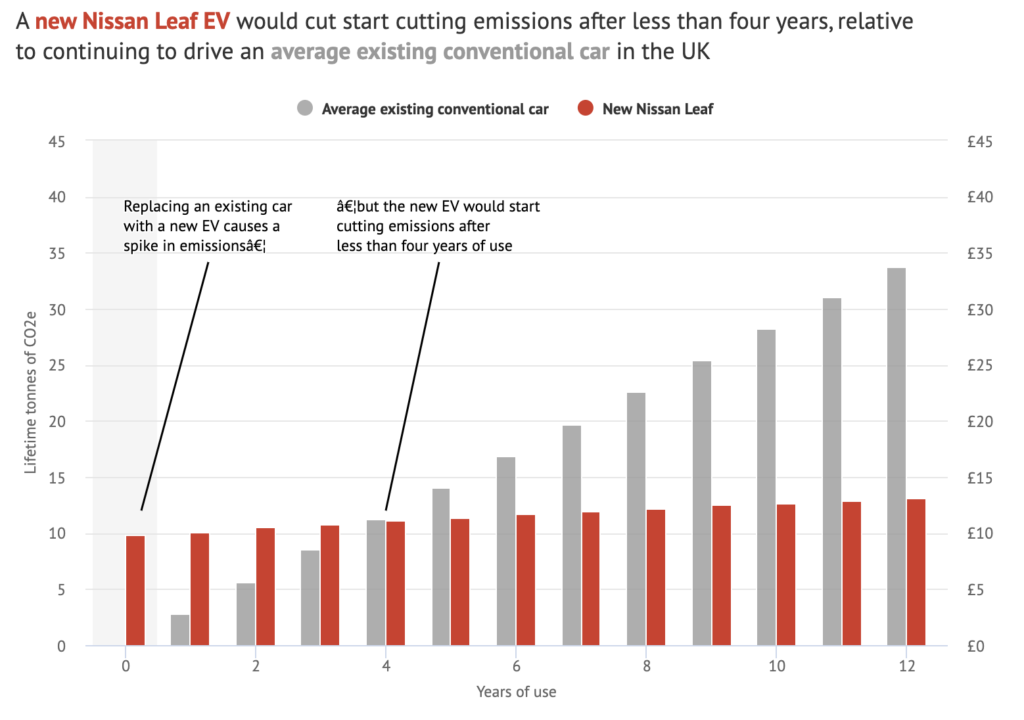
This equation would become even clearer were it not for the generous assumption that the existing conventional car has emissions equal to the average new vehicle.
Note that the cumulative lifetime emissions charts above are based on mileage of 150,000km over 12 years, or some 7,800 miles per year, for consistency with the remainder of the article.
This figure is slightly higher than the UK average annual mileage, which fell closer to 7,100 miles in 2017. Even at this lower mileage, however, replacing an existing conventional car with an EV would start cutting emissions within just over four years.
Problematic fuel economy estimates
The ifo study provides an example of the potential pitfalls of using test-cycle fuel economy values instead of real-world performance. The study compared the lifetime emissions from a Mercedes C 220 to the new Tesla Model 3, taking into account emissions associated with vehicle production. It found that the Tesla had emissions between 90% and 125% of the Mercedes over the lifetime of the vehicle.
In other words, despite the headlines it generated, even ifo found that EVs ranged from being slightly better to somewhat worse than a diesel vehicle.
The study assumed a fuel economy of 52 miles per gallon (mpg) for the Mercedes, which is significantly higher than the average car in the US (25mpg for petrol vehicles), but similar to average fuel economy in the UK (52mpg for petrol vehicles and 61mpg for diesel vehicles). However, different fuel-economy testing procedures produce quite different results.
While the US EPA fuel economy numbers tend to reflect actual driving conditions, the New European Driving Cycle (NEDC) values used in the EU exaggerate actual vehicle fuel economy by up to 50% – and potentially even more for Mercedes vehicles.
The Tesla Model 3 energy use assumed in the study (241 watt-hours per mile), by contrast, is only 8% smaller than the EPA estimates of real-world use (260 watt-hours/mile). Using more realistic estimates of fuel economy for the conventional vehicle would have a large effect on the results of the ifo analysis, making the EV option preferable to the conventional vehicle.
Large differences in battery emissions
Both the ifo study and the ICCT analysis rely on the same estimate of emissions from battery manufacturing: a 2017 study by the Swedish Environmental Research Institute (IVL). IVL examined studies published between 2010 and 2016, and concluded that battery manufacturing emissions are likely between 150 and 200 kg CO2-equivalent per kWh of battery capacity.
The majority of studies examined by IVL looked at battery production in Asia, rather than in the US or Europe. The IVL study also noted that battery technology was evolving rapidly and that there is great potential for reduction in manufacturing emissions.
The IVL study came under considerable criticism, and in late 2019 received a substantial revision. The IVL researchers now estimate that battery manufacturing emissions are actually between 61 and 106 kg CO2-equivalent per kWh, with an upper bound of 146 kg. The low end estimate of 61 kg is for cases when the energy used from battery manufacturing comes from zero-carbon sources. IVL suggests that this revision was driven by new data for cell production, including more realistic measurements of energy use for commercial-scale battery factories that have substantially expanded in scale and output in recent years.
Carbon Brief undertook its own assessment of the literature to find recently published estimates of lifecycle emissions from battery manufacturing. The figure below shows data from 17 different studies, including seven published after the 2017 IVL estimate. It divides studies based on the region in which the batteries were produced: Asia (in red), Europe (light blue), US (dark blue) and reviews that examine multiple regions (grey).
Most of the studies published in recent years show lifecycle emissions smaller than those in the original IVL study, with an average of around 100kg CO2 per kWh for those published after 2017. These new estimates are well in-line with the revised 2019 IVL study numbers. Manufacturing emission estimates are generally higher in Asia than in Europe or the US, reflecting the widespread use of coal for electricity generation in the region. Studies that directly compared batteries manufactured in Asia to those in the US or Europe found lifecycle emissions around 20% lower outside of Asia.
A number of studies break down emissions into mining, refining and other material production that happens off-site, as well as the actual manufacturing process where the battery is assembled. These tend to find that about half the lifecycle emissions are a result of off-site material production and half result from electricity used in the manufacturing process. This is shown in the table below, taken from the 2017 IVL report, which breaks down lifecycle emissions by component and manufacturing stage.
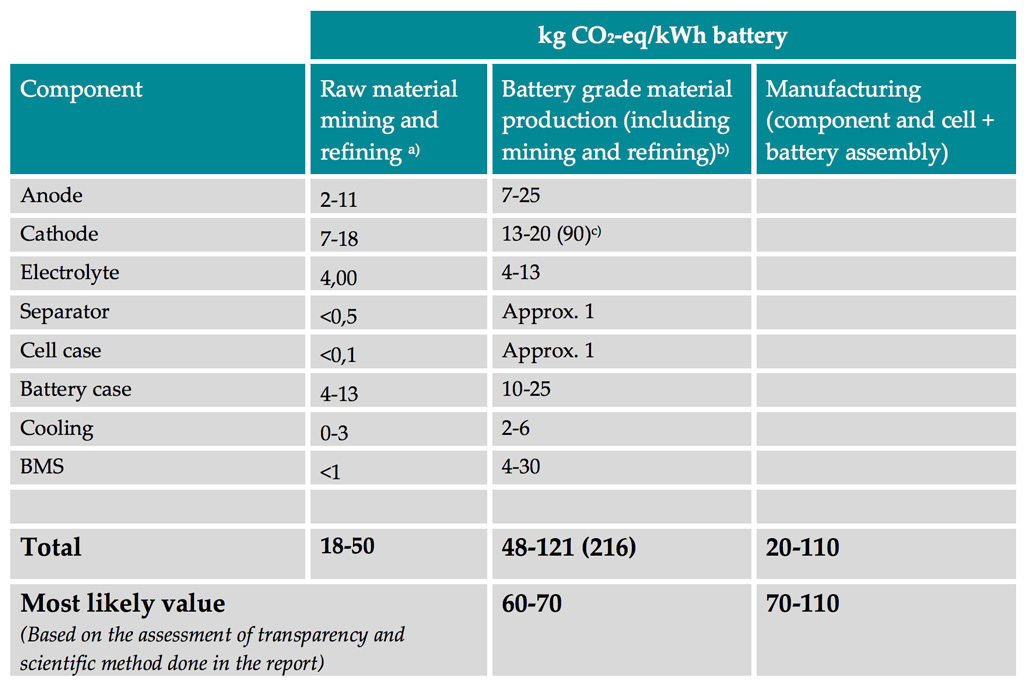
As the IVL study notes:
“Manufacturing stands for a large part of the production impact…This implies that production location and/or electricity mix has great potential to impact the results.”
This is an important factor to consider when estimating battery emissions from Tesla’s Gigafactory in Nevada, which produced all of the batteries currently used in Model 3 vehicles.
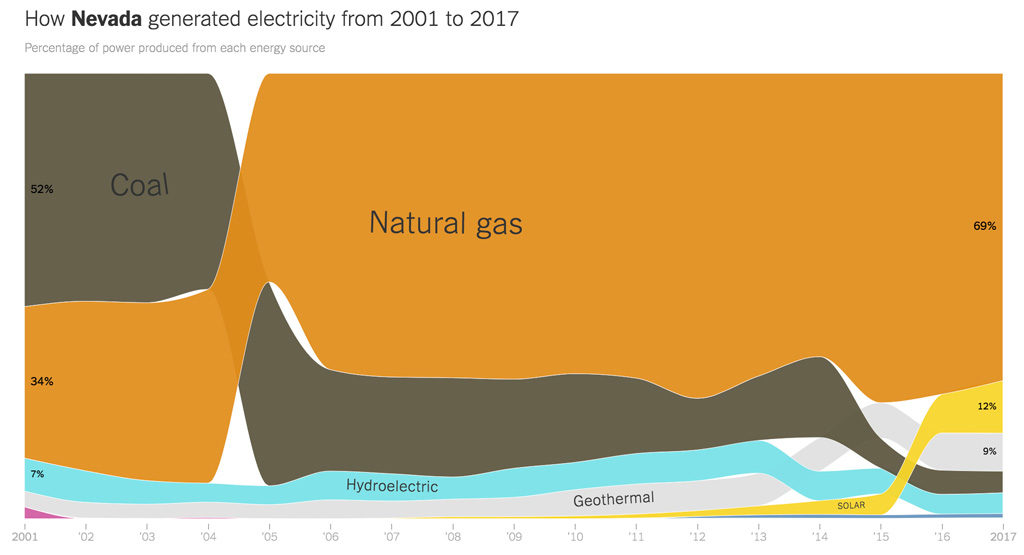
Nevada, where Tesla’s Gigafactory is located, has electricity that is, on average, around 30% lower in carbon intensity than the US average. Nevada has phased out nearly all of its coal-based power generation over the past two decades, as shown in the figure below.
Tesla recently began construction of the world’s largest solar roof on top of its Gigafactory, which, when coupled with battery storage, should provide nearly all of the electricity used by the facility.
The image below shows the current status of solar panel installation as of 18 April 2019, though the plan is for nearly the entire roof to be covered by panels when the installation is complete.

The Gigafactory was also built with a focus on energy efficiency, employing material reuse when possible. However, it is unclear what the actual energy use and emissions associated with battery production at the site are as Tesla has not released any figures.
Given the lower lifecycle manufacturing emission estimates of studies in recent years – and the location of the manufacturing facility in a state with a relatively low-carbon electricity generation mix – Carbon Brief provides an estimate of 61kg CO2-equivalent per kWh based on the revised IVL study.
This is quite similar to a recent estimate for battery production in Germany by the Research Center for Energy Economics (FFE). FFE found that if batteries were produced using renewable energy, as is the goal for the Nevada Gigafactory, emissions would fall down to 62kg CO2-equivalent per kWh.
How and when electricity is generated matters
The climate benefit of EVs depend not only on the country where an EV is used, but also what region of the country it is used in. In the US, for example, there is a wide variation in how electricity is generated, with much cleaner electricity in places such as California or New York than in the middle parts of the country.
How the emissions from electricity generation are calculated is also important. While many analyses – including the ones earlier in this article – make use of the average emissions from electricity generation, Michalek tells Carbon Brief that using these values can produce somewhat misleading results.
It would be more accurate to use marginal emissions, Michalek says. This reflects emissions from the power plants turned on to meet new demand from EV charging. He explains:
“Some plants, like nuclear, hydro, wind and solar are generally fully utilised and will not change their generation output if you buy an EV. What changes, at least in the short run, is primarily that coal and natural gas plants will increase generation in response to this new load. So, if your question is ‘what will be the emissions consequences if I buy an EV versus a gasoline vehicle,’ which I think is the right question for policy, then the answer should use the consequential grid mix (for small changes this is the marginal generation mix) rather than the average. The marginal grid mix typically has higher emissions intensity than the average.”
However, the marginal emissions are something of a short-term estimate of EV impacts. As the demand from more EVs is added to the grid, gas and coal resources that are currently not being utilised may increase their output, but over the longer term additional generation sources will come online.
Michalek explains that the impact of EV adoption on future power plant construction is an area of active research.
In 2016, Michalek and colleagues published a paper in Environmental Research Letters taking into account a whole host of factors – including the marginal grid mix, ambient temperature, patterns of vehicle miles travelled and driving conditions (city versus highway) – in order to make the most accurate possible comparison between EV and similar conventional vehicles at the time.
The figure below shows their results. In the left column, the most efficient petrol vehicle – a Toyota Prius – is compared to one fully electric vehicle – a Nissan Leaf – and two plug-in electric hybrid vehicles – a Chevrolet Volt and a Toyota Prius Plug-in Hybrid. The right column shows the same analysis, but for a typical conventional vehicle of the same size – a Mazda 3. Each county in the country is colored red if the petrol vehicle has lower emissions and blue if the electric vehicle has lower emissions.

They found that the Nissan Leaf EV is considerably better than a similar typical conventional vehicle outside of parts of the Midwest that rely heavily on coal for marginal emissions. However, when compared to the most efficient conventional vehicle, the climate benefits of the EV were near-zero or negative in large parts of the country.
This study examines the current mix of electricity generation, which will likely become less carbon-intensive over the lifetime of vehicles operating today. However, the authors caution that the relationship between average emission reductions and marginal emission reductions is not always clearcut. Because marginal emissions come primarily from fossil-fuel plants, emission reductions for EV charging will occur mainly when gas displaces coal at the margin, or when widespread EV adoption requires bringing new low-carbon electricity generation facilities online to meet demand.
Electric vehicles ‘not a panacea’ without decarbonisation
In both the US and Europe, EVs represent a substantial reduction in lifecycle greenhouse gas emissions compared to the average conventional vehicle. This has been a consistent finding across the overwhelming majority of studies examined by Carbon Brief.
However, Michalek cautions that:
“EVs are not currently a panacea for climate change…lifecycle GHG emissions from electric vehicles can be similar to or even greater than the most efficient gasoline or diesel vehicles [in the US].”
As electricity generation becomes less carbon intensive – particularly at the margin – electric vehicles will become preferable to all conventional vehicles in virtually all cases. There are fundamental limitations on how efficient petrol and diesel vehicles can become, whereas low-carbon electricity and increased battery manufacturing efficiency can cut much of the manufacturing emissions and nearly all electricity use emissions from EVs.
A transition from conventional petrol and diesel vehicles to EVs plays a large role in mitigation pathways that limit warming to meet Paris Agreement targets. However, it depends on rapid decarbonisation of electricity generation to be effective. If countries do not replace coal and, to a lesser extent, gas, then electric vehicles will still remain far from being “zero emissions”.
Methodology
US values in the first three figures were estimated by Carbon Brief based on US grid emission factors from EPA eGRID 2018 modified with Rhodium Group estimates for 2019 and electricity fuel cycle estimates from Michalek et al 2011. Error bars reflect lifecycle battery manufacturing estimates ranging from 61 to 146kgCO2e per kWh (kgCO2e/kWh) used in the revised 2019 IVL study, with its central range being 61-100kgCO2e/kWh.
EU average and per-country grid emissions factors for 2019 were taken from Sandbag 2020. Leaf emissions were based on a 40kWh battery, a fuel economy estimate of 26kWh per 100 miles and a conservative top-end central estimate of 100kgCO2/kWh for battery production.
The Peugeot 208 1.6 BlueHDi used in the original Hall and Lutsey 2018 figure was replaced by a 2019 Toyota Prius Eco hybrid car, which is more comparable in size to both the Leaf and Model 3 and has the highest fuel economy of any commercially available car, with a 56 miles per gallon EPA rating – which is similar to the fuel use in actual driving conditions.
Model 3 emissions were estimated using a fuel economy value of 25kWh per 100 miles for the long-range 75kWh battery model. Non-battery manufacturing emissions were assumed to be the same as those of the Nissan Leaf used in the ICCT analysis. Battery emissions from the Nevada Gigafactory were assumed to be at the bottom end of the central range from the IVL study – 61kgCO2e/kWh – based on the combination of a zero-carbon generation mix, the widespread use of efficiency measures in manufacturing and the use of on-site renewable energy as discussed in the article.
The following studies were used by Carbon Brief in the battery lifecycle emissions literature review:
Philippot, M. et al. (2019) Eco-Efficiency of a Lithium-Ion Battery for Electric Vehicles: Influence of Manufacturing Country and Commodity Prices on GHG Emissions and Costs, Batteries, doi:10.3390/batteries5010023
Regett, A. et al. (2018) Carbon footprint of electric vehicles – a plea for more objectivity, FFE white paper.
GREET model (2018) The Greenhouse gases, Regulated Emissions, and Energy use in Transportation Model, Argonne National Laboratory.
Messagie, M. (2017). Life Cycle Analysis of the Climate Impact of Electric Vehicles, Vrije Universiteit Brussel, Transport & Environment white paper.
Han, H. et al (2017). GHG Emissions from the Production of Lithium-Ion Batteries for Electric Vehicles in China, Sustainability, doi:10.3390/su9040504
Romare, M. and Dahllöf, L. (2017) The Life Cycle Energy Consumption and Greenhouse Gas Emissions from Lithium-Ion Batteries, IVL Swedish Environmental Research Institute white paper.
Wolfram, P. and Wiedmann, T. (2017) Electrifying Australian transport: Hybrid life cycle analysis of a transition to electric light-duty vehicles and renewable electricity, Applied Energy, doi:10.1016/j.apenergy.2017.08.219
Wang, Y. et al. (2017) Quantifying the environmental impact of a Li-rich high-capacity cathode material in electric vehicles via life cycle assessment, Environmental Science and Pollution Research, doi:10.1007/s11356-016-7849-9
Ambrose, H. and Kendall, A. (2016) Effects of battery chemistry and performance on the life cycle greenhouse gas intensity of electric mobility. Transportation Research Part D: Transport and Environment, doi:10.1016/j.trd.2016.05.009
Dunn, J. et al. (2016) Life Cycle Analysis Summary for Automotive Lithium-Ion Battery Production and Recycling, In: Kirchain R.E. et al. (eds) REWAS 2016. doi:10.1007/978-3-319-48768-7_11
Ellingsen, L. et al. (2016) The size and range effect: lifecycle greenhouse gas emissions of electric vehicles, Environmental Research Letters, doi:10.1088/1748-9326/11/5/054010
Kim, H. et al. (2016) Cradle-to-Gate Emissions from a Commercial Electric Vehicle Li-Ion Battery: A Comparative Analysis, Environmental Science & Technology, doi:10.1021/acs.est.6b00830
Peters, J. et al. (2016) The environmental impact of Li-Ion batteries and the role of key parameters – A review, Renewable and Sustainable Energy Reviews, doi:10.1016/j.rser.2016.08.039
Nealer, R. et al. (2015) Cleaner Cars from Cradle to Grave, Union of Concerned Scientists white paper.
Hart, K. et al. (2013) Application of LifeCycle Assessment to Nanoscale Technology: Lithium-ion Batteries for Electric Vehicles. US EPA report 744-R-12-001.
Dunn, J. et al. (2012) Impact of recycling on cradle-to-gate energy consumption and greenhouse gas emissions of automotive lithium-ion batteries, Environmental Science & Technology. doi:10.1021/es302420z
Majeau-Bettez, G. et al. (2011) Life Cycle Environmental Assessment of Lithium-Ion and
Nickel Metal Hydride Batteries for Plug-In Hybrid and Battery Electric Vehicles, Environmental Science & Technology. doi:10.1021/es103607c
Update 6-2-2020:
This article was updated to include the new battery manufacturing emissions values from the revised 2019 IVL study, replacing the 2017 IVL study values used in the original version of the article.
-
Factcheck: How electric vehicles help to tackle climate change
-
Factcheck: Electric vehicles are cleaner than fossil-fuelled cars

