‘Every 0.1C’ of overshoot above 1.5C increases risk of crossing tipping points
Ayesha Tandon
08.01.24Ayesha Tandon
01.08.2024 | 10:00amEvery increment of global warming above 1.5C increases the risk of crossing key tipping points in the Earth system – even if the overshoot is only temporary, says new research.
It is well established that if global temperatures exceed 1.5C above pre-industrial levels, there is a higher risk that tipping points will be crossed.
The new study, published in Nature Communications, investigates the risk of crossing four interconnected tipping points under different “policy-relevant” future emissions scenarios.
The authors investigate the risk of tipping where warming temporarily overshoots 1.5C, but global temperatures are then brought back down using negative emissions technologies. They find that the longer the 1.5C threshold is breached, and the higher the peak temperature, the greater the risk of crossing tipping points.
The most pessimistic scenario in the study sees global warming hit 3.3C by the end of the century – in line with the climate policies of 2020 – before dropping back below 1.5C over 2100-2300. Under this pathway, there is a 45% chance of crossing tipping points by 2300, the authors say.
The authors also warn that if global temperatures rise above 2C, the additional risk of tipping for every extra increment of warming “strongly accelerates”.
For temperatures between 1.5C and 2C, the risk increases by 1-1.5% for every 0.1C increase in overshoot temperature. However, for temperatures above 2.5C, tipping risk increases to 3% per 0.1C of overshoot.
The research “underlines the need for urgent emission cuts now that do not assume substantial carbon dioxide removal later”, a scientist not involved in the study tells Carbon Brief.
Overshoot scenarios
Scientists have warned for decades that as the planet warms, there is an increasing risk that Earth systems will cross “tipping points” – critical thresholds that, if exceeded, could push a system into an entirely new state.
For example, if climate change and human-driven deforestation push the Amazon rainforest past a critical threshold, large parts of the forest could experience “dieback”. This would cause entire sections of lush rainforest to eventually shift to dry savannah.
(See Carbon Brief’s explainer on the nine tipping points that could be crossed as a result of climate change.)
The planet has already warmed by 1.3C above pre-industrial levels, and a recent study warned that five tipping elements – including the collapse of the west Antarctic ice sheet – are already within reach.
That study emphasised the importance of limiting global temperature rise to 1.5C above pre-industrial levels – in line with the 2015 Paris Agreement. It finds that warming of 1.5C would render four climate tipping elements “likely” and a further six “possible”. Meanwhile, 13 tipping elements will be either “likely” or “possible” if the planet warms by 2.6C, as expected under current climate policies.
Many of the potential pathways to limiting global temperature rise to 1.5C by 2100 see the planet initially “overshoot” the threshold before negative emissions methods are used to bring temperatures back down.
The new paper investigates 10 future warming scenarios which run to the year 2300. The authors use the PROVIDE v1.2 emission pathways, which they describe as “an extended version of the illustrative pathways identified” used in the recent sixth assessment of the Intergovernmental Panel on Climate Change (IPCC).
The original scenarios run over 2015-2300, but the authors carried them forward for another 50,000 years by following the temperature trajectory set over 2290-2300. All scenarios stabilise at 1.5C, 1C or pre-industrial temperatures. However, many include overshoots, with peak temperatures ranging from 1.57C to 3.30C.
These scenarios show a range of options for how global temperatures change under these 10 scenarios in the “medium term” – until the year 2300 – as well as in the “long term”, which runs 50,000 years into the future to see how the planet eventually stabilises.
Scenarios that reach net-zero or negative emissions by 2100 and maintain them thereafter are classified as “NZGHG emission scenarios”. The table below gives more detail on each scenario.
| Scenario | Overshoot peak temperature | NZGHG | Stabilisation temperature | Scenario assumptions |
|---|---|---|---|---|
| CurPol-OS-1.5C | 3.30C | No-NZGHG | 1.5C | Follows current (2020) policies until 2100, then declines |
| ModAct-OS-1.5C | 2.69C | No-NZGHG | 1.5C | Follows current (2020) pledges (NDCs) until 2100, then declines |
| ModAct-OS-1C | 2.69C | No-NZGHG | 1.0C | Follows current (2020) pledges (NDCs) until 2100, then declines |
| Ref-1p5 | - | not defined | 1.5C | Reference scenario designed in temperature space |
| SSP5-3.4-OS | 2.35C | No-long-term-NZGHG | 1.5C | Tests system response to rapid emission changes |
| SSP1-1.9 | 1.53C | No-long-term-NZGHG | 1.0C | Sustainable development, no long-term compensation of non-CO2 emissions |
| GS-NZGHG | 1.70C | NZGHG | pre-industrial | Gradual strengthening, returns warming to 1.5 °C by 2215 |
| SP-NZGHG | 1.57C | NZGHG | pre-industrial | Broad shift towards sustainable development |
| Neg-NZGHG | 1.67C | NZGHG | pre-industrial | Returns warming to 1.5 °C by 2100 with heavy CDR deployment |
| Neg-OS-OC | 1.67C | NZGHG | pre-industrial | Returns warming to 1.5 °C by 2100 with heavy CDR deployment |
There is quite a range between the 10 pathways.
At the high end, the “CurPol-OS-1.5C” scenario sees a continuation of the global climate policies implemented in 2020 until the year 2100, with warming peaking at 3.3C. It then sees a decline in global temperature until reaching a stabilisation of 1.5C by the year 2300.
At the low end, “Neg-OS-0C” scenario initially overshoots 1.5C to 1.67C, but then returns warming to 1.5C by 2100 using “heavy carbon dioxide removal deployment”. It also then sees average global temperatures drop to pre-industrial levels by the year 2300.
In the middle, the Ref-1p5 scenario is the only one that does not include an overshoot, instead stabilising quickly at 1.5C.
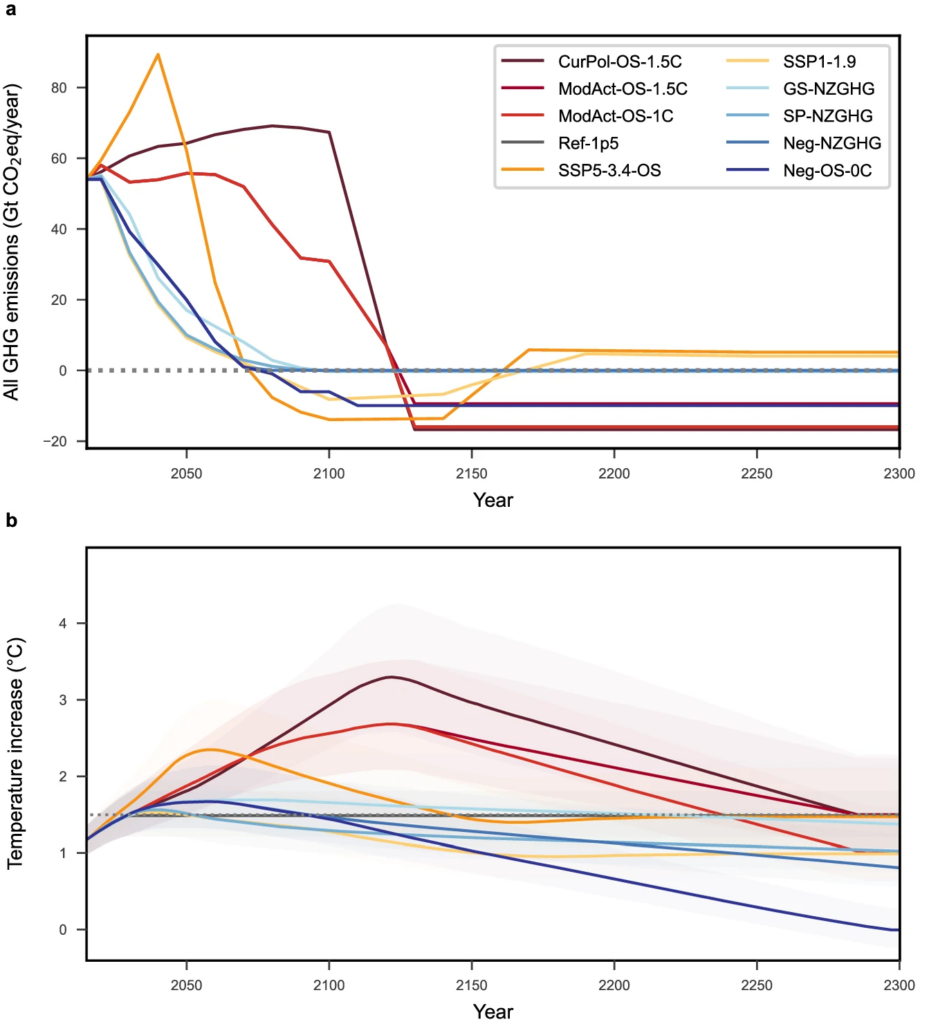
The chart below shows greenhouse gas emissions (top) and corresponding global temperature changes (bottom) associated with each scenario, identified by the different-coloured lines. The bottom chart illustrates the range in how quickly the pathways return to 1.5C or below.
Dr David McKay is a research impact fellow at the University of Exeter’s Global Systems Institute, who has published extensively on climate tipping points, but was not involved in this study.
He also notes that some of the scenarios shown in this study “may not be possible”, because there is debate about whether or not “the substantial carbon dioxide removal needed for large overshoots is feasible”.
Cascades
Many Earth systems are interlinked, so crossing one tipping point can increase the likelihood of crossing others. This is often described as a “domino effect” or “tipping cascade”.
The study focuses on four interconnected tipping points – collapse of the Greenland ice sheet and west Antarctic ice sheet, shutdown of the Atlantic Meridional Overturning Circulation and dieback of the Amazon rainforest.
Annika Högner is a researcher at the Potsdam Institute for Climate Impact Research (PIK) and co-lead author on the study. She tells Carbon Brief these four tipping points were chosen because they “play a significant role in the functioning of the Earth system” and “their tipping would have severe global impacts”.
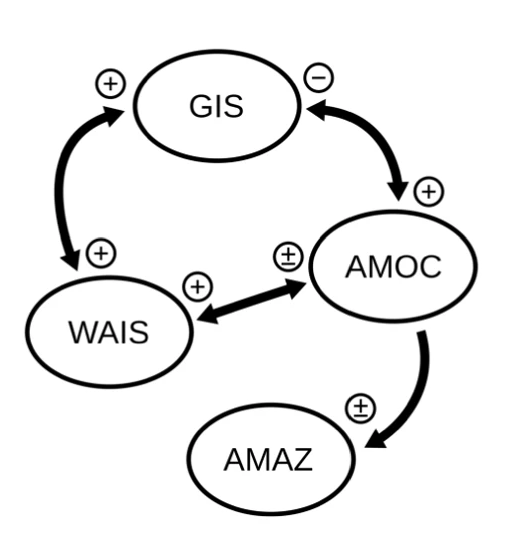
The graphic below shows how the tipping points interact with each other. A “+” symbol indicates that crossing one tipping point can destabilise another. For example, a collapse of the Greenland ice sheet makes the AMOC more likely to shut down, as a result of the sudden influx of freshwater into the north Atlantic Ocean. A “±” symbol indicates that the relationship between two tipping points is uncertain.
A “-” symbol indicates that crossing one tipping point stabilises another. Högner tells Carbon Brief that the interaction between the Greenland ice sheet and AMOC is the only stabilising interaction in this study. She explains that if the AMOC were to cross a tipping point, “we [would] expect to see strong cooling in the northern hemisphere”, which will contribute to stabilising the Greenland ice sheet.
Earth system models “often don’t resolve tipping processes very well”, making them less suited to modelling full tipping cascades, Högner tells Carbon Brief.
Instead, she explains that the authors developed a “conceptual model”. This model does not attempt to simulate the entire Earth system, but instead just models the likelihood of tipping at different temperatures, based on existing knowledge about tipping elements from other studies.
The model takes temperature trajectories as an input and gives the state of the tipping elements after a specified time – that is, whether or not the element has tipped – as an output.
Importantly, these models include “hysteresis” – a feature of tipping systems, in which a system that has moved to a different state does not easily move back to the original state even if temperatures are reduced again.
Tipping risk
The authors use their conceptual model to calculate “tipping risk” under the 10 future warming scenarios. Högner tells Carbon Brief that tipping risk “refers to the model of all four interacting tipping elements analysed in the study”. For example, a 50% tipping risk means there is a 50% chance that at least one of the four climate elements will tip.
The top row of the graphic below shows the risk of tipping in the year 2300 (left) and in 50,000 years from now (right). Bars placed higher up indicate a greater likelihood of tipping. The dot shows the average value for each data point, while the bars show the 10-90% range.
The text on the right hand side gives likelihood levels in the calibrated language used by the IPCC: very likely means a likelihood of 90-100%, likely is 66-100%, about as likely as not is 33-66%; unlikely is 0-33%; and very unlikely is 0-10%.
The middle row shows the peak temperature under each scenario (left) and stabilisation temperature (right). The bottom row shows how long temperatures overshoot before stabilising in each scenario.
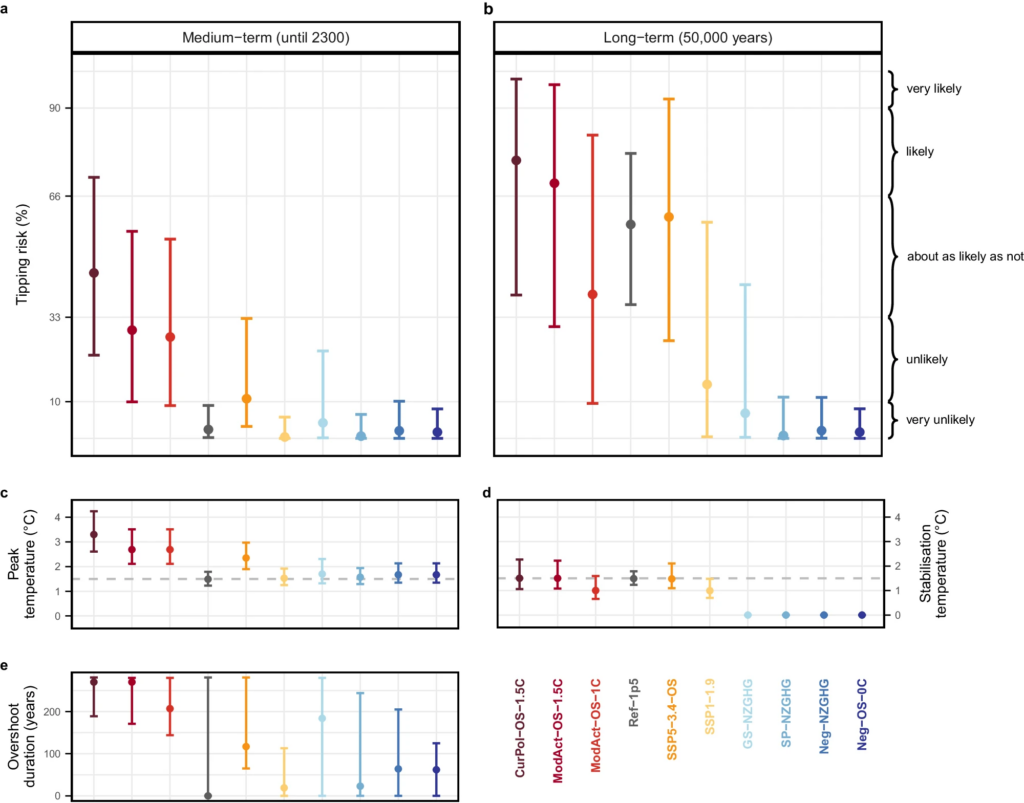
The longer the 1.5C threshold is breached for, and the higher the peak temperature is, the greater the risk of crossing tipping points by the year 2300, the study shows.
The authors find the greatest risk of crossing tipping points in the CurPol-OS-1.5C scenario (red), which follows the climate policies of 2020 until the year 2100 and then reaches 1.5C by 2300, as this scenario has the greatest overshoot temperature and duration.
Under this scenario, there is a 45% tipping risk by 2300 and a 76% chance in 50,000 years, according to the paper.
The five pathways that do not return warming to 1.5C by the year 2100 have the greatest medium-term risks, and those with less than 0.1C overshoot have the lowest medium-term risks.
In the long-term – looking to the next 50,000 years – the authors find that stabilisation temperature is “one of the decisive variables for tipping risks”. They find that even in the Ref1p5 scenario – which sees global temperatures stabilise at 1.5C without any overshoot – there is a 50% risk of the system tipping over the next 50,000 years.
The results “illustrate that a global mean temperature increase of 1.5C is not ‘safe’ in terms of planetary stability, but must be seen as an upper limit”, the study warns.
Högner tells Carbon Brief that the paper “underlines the importance of adhering to the Paris Agreement temperature goal”.
Tessa Möller – a researcher at the International Institute for Applied Systems Analysis (IIASA) and co-lead author on the paper – tells Carbon Brief that “we have a wide portfolio of technologies available” to limit warming to 1.5C, and just need to “implement” them.
However, she also highlights the “large credibility gap” between pledges from individual countries and the policies they have actually implemented. She tells Carbon Brief that not only do we need “stronger pledges”, but it is also essential that countries follow through on them.
Long-term climate
The authors also explore the risk of each individual tipping point being crossed in different scenarios.
The plot below shows the tipping risk by 2300 under different scenarios, at different temperatures, on the left. Each colour represents one scenario. Dots positioned further to the right indicate a greater peak temperature and dots positioned higher up indicate a greater tipping risk.
The plot on the right shows the percentage change in tipping risk for every additional 0.1C of overshoot, for different peak global temperatures, for the Amazon (cross), AMOC (plus), West Antarctic ice sheet (black dot) Greenland Ice sheet (square) and overall (yellow dot).
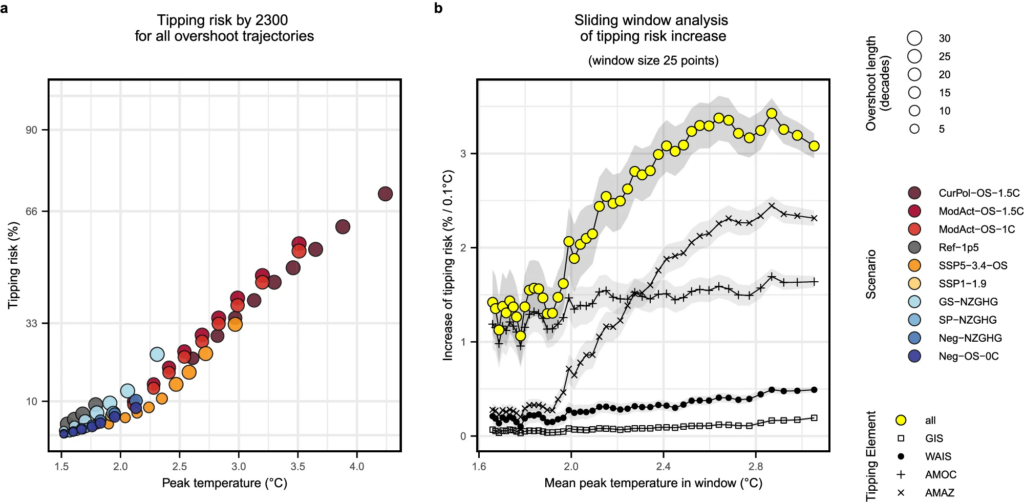
The authors find that AMOC collapse and Amazon dieback would likely be the first components to tip. This could be in the next 15-300 years and 50-200 years, respectively, depending on the scenario, they find.
Meanwhile, the Greenland and west Antarctic ice sheets have tipping timescales of 1,000-15,000 years and 500-13,000 years, respectively.
However, they note that as temperatures increase, the relative risk of each element tipping changes. The graph shows that while AMOC is the main driver of tipping risk at lower temperatures, the Amazon becomes the main driver once global temperatures exceed 2C.
Finally, they find that as global temperatures rise, the risk of tipping accelerates. Overall, tipping risk increases by 1-1.5% per 0.1C increase in overshoot temperature, for temperatures below 2C, according to the study. However, above 2.5C, tipping risk increases to 3% per 0.1C increase overshoot.
McKay notes that there are some limitations in the study. For example, he notes that the paper “has to rely on tipping threshold and timescale estimates with often wide ranges and sometimes low confidence, while tipping interaction estimates are based on dated expert judgement”.
However, he adds:
“This work makes it clear that every fraction of warming increases the chance of tipping points, even if global temperature subsequently falls, and underlines the need for urgent emission cuts now that do not assume substantial carbon dioxide removal later.”


Möller, T. et al. (2024) Achieving net-zero greenhouse gas emissions critical to limit climate tipping risks, Nature Communications, doi: 10.1038/s41467-024-49863-0
-
‘Every 0.1C’ of overshoot above 1.5C increases risk of crossing tipping points