Animation: Satellite images of ‘surging’ glaciers in Asia
Robert McSweeney
11.26.15Robert McSweeney
26.11.2015 | 1:06pmA new study has created a series of animations that capture ‘surging’ glaciers in the Karakoram mountain range in Asia over 25 years, from 1990 to 2015.
Glaciers are huge rivers of ice formed from snow compacted over many years. Powered by the sheer weight of ice they contain, they gradually slide down mountain sides and along valleys.
Karakoram’s glaciers are well-known for ‘surging’. A surging glacier varies between long dormant periods of little change – lasting tens to hundreds of years – and short surging phases, where accumulated ice at higher elevations flows rapidly down to its front.
Surging isn’t the glacier melting, but rather it’s a glacier’s way of evening itself out when it gets top-heavy.
Active surging phases typically last a few months or several years, with flows up to a thousand times faster than usual. The transfer of ice means the top of the glacier thins while the front gets thicker – perhaps by as much as 200 metres.
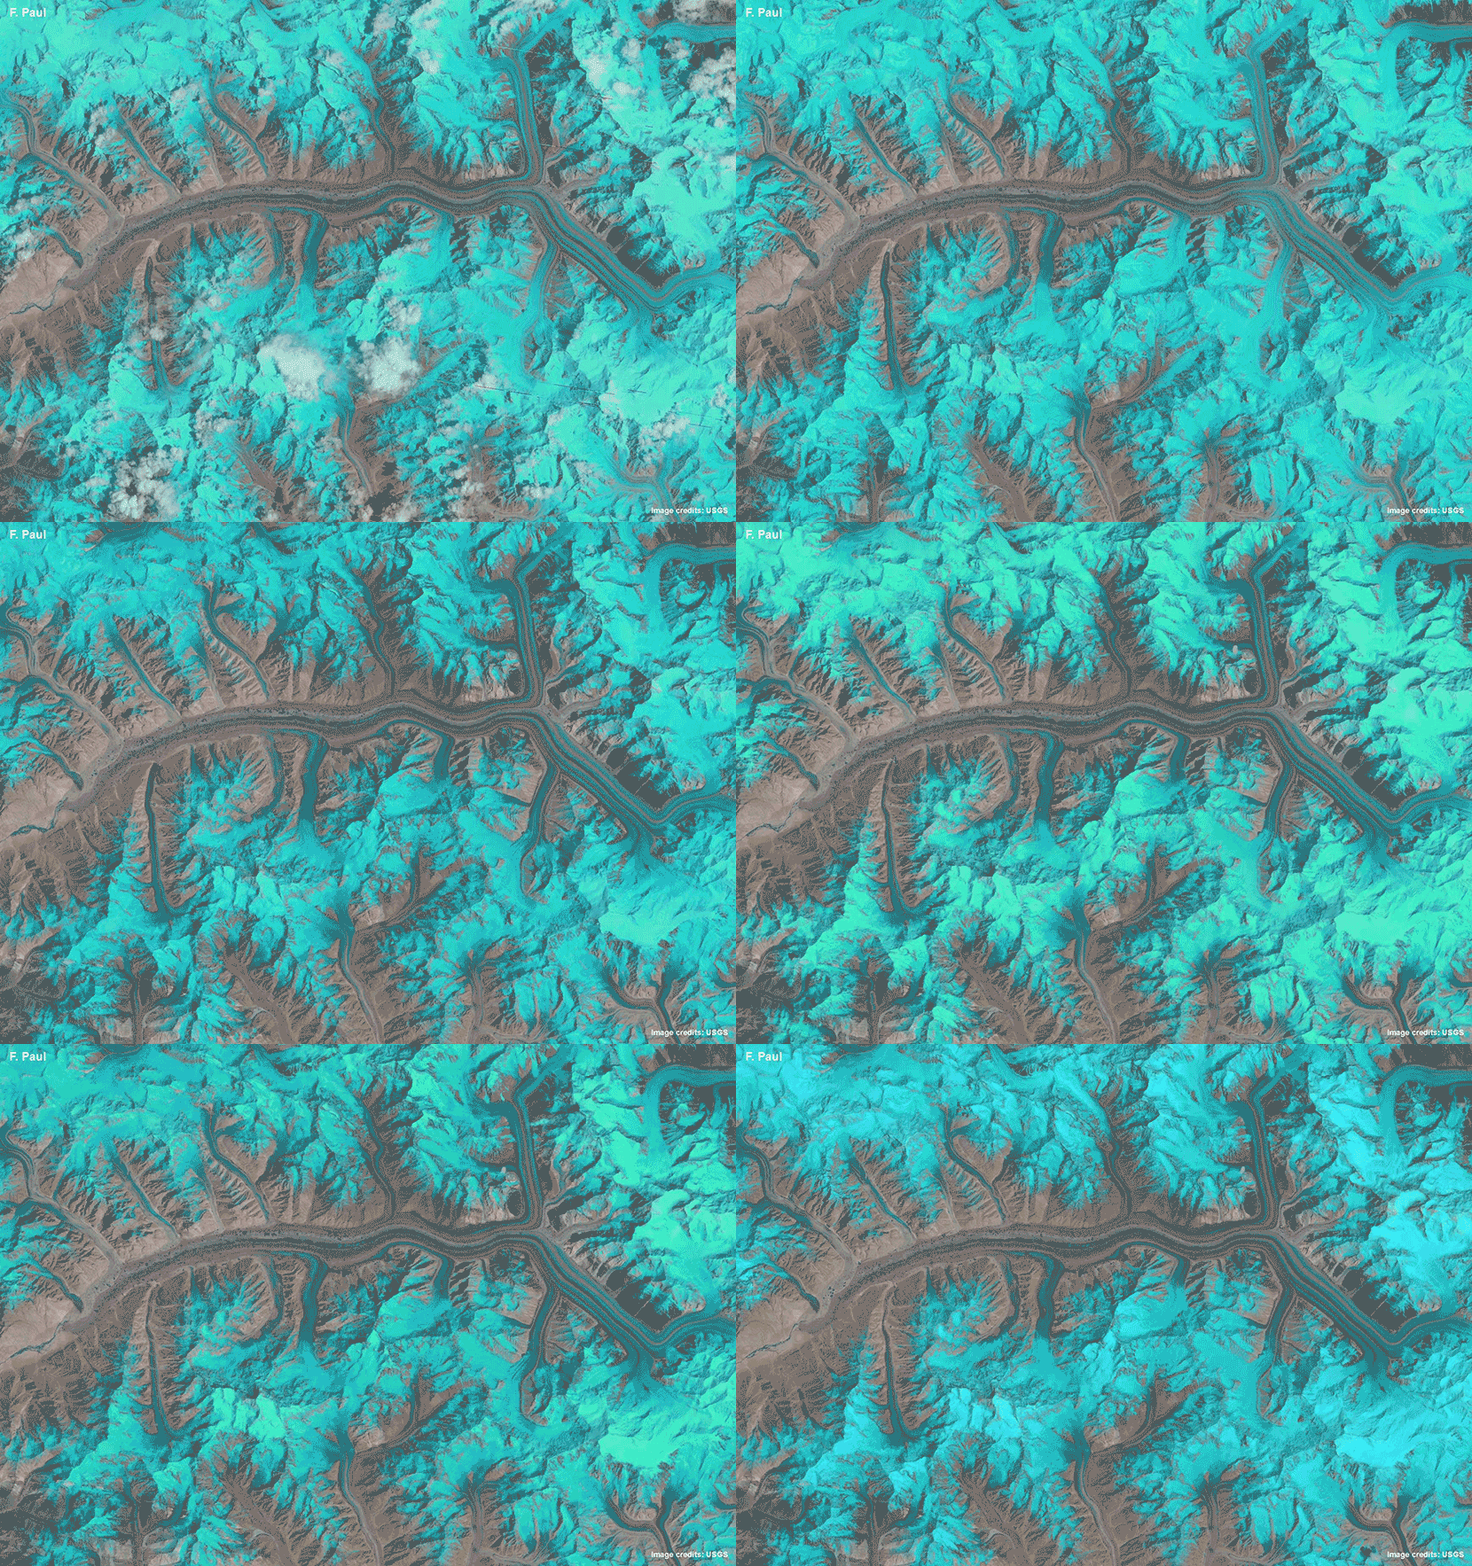
You can see surging glaciers in action in the animation below of the Panmah glacier, which is flowing from top to bottom down the middle of the image. On the right-hand side, there are five tributaries feeding into the Panmah glacier that suddenly shoot forwards – this is surging.
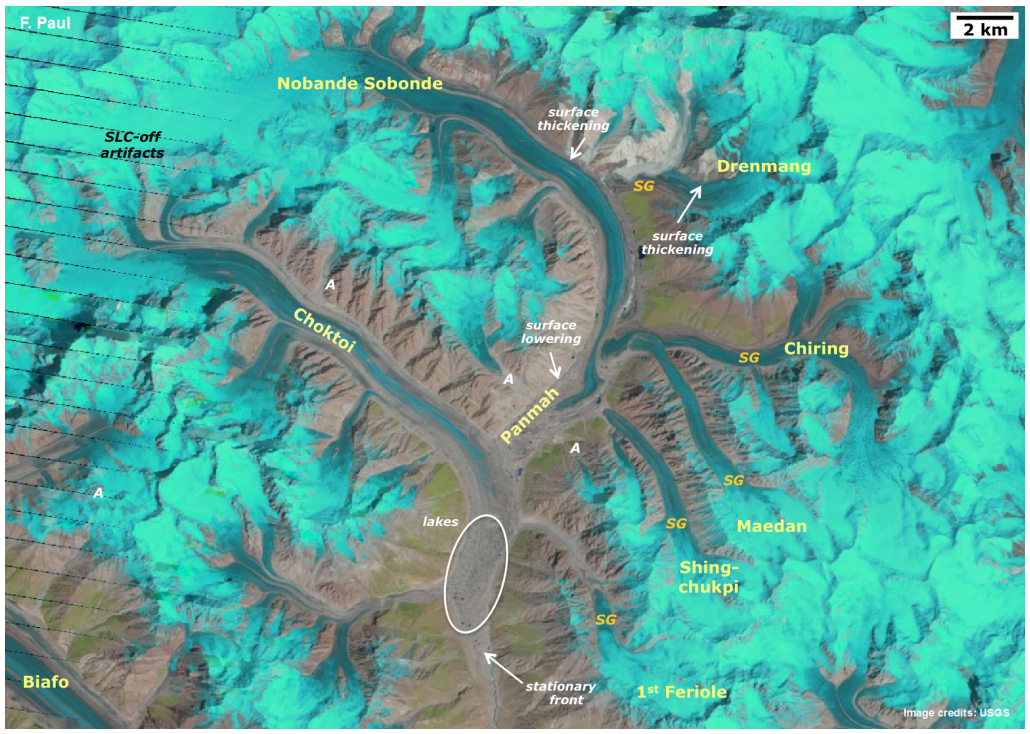
The still image below the animation can help you spot what to look out for. The surging glaciers are marked with an orange “SG”.

Animation of the Panmah glacier (flowing down the centre of the image), the Choktoi glacier (flowing from the left-hand side) and their surrounding tributaries. Glaciers are shown in blue, snow cover in bright blue, clouds in white, water in dark blue, vegetation in green and bare terrain in brown. Source: Paul (2015)

Still image of the Panmah glacier and their surrounding tributaries. Shows glacier names in orange, actively surging glaciers (orange “SG”) and advancing glaciers (white “A”). Source: Paul (2015)
The study, just published in The Cryosphere, focuses on four regions in the central Karakoram mountain range, which runs along China’s border with India and Pakistan – as the map below shows. The range is most famous for K2, the second highest mountain in the world, but it also home to more glaciers than anywhere outside of the polar regions.

Map of central Karakoram. Yellow rectangles show the four regions that animations were made for: 1) Baltoro, 2) Panmah and Choktoi, 3) Skamri–Sarpo Laggo, and 4) Shaksgam. The black square in the inset shows the location of the study region in the Karakoram mountain range. Sources: Paul (2015), USGS/NASA, and Google Earth.
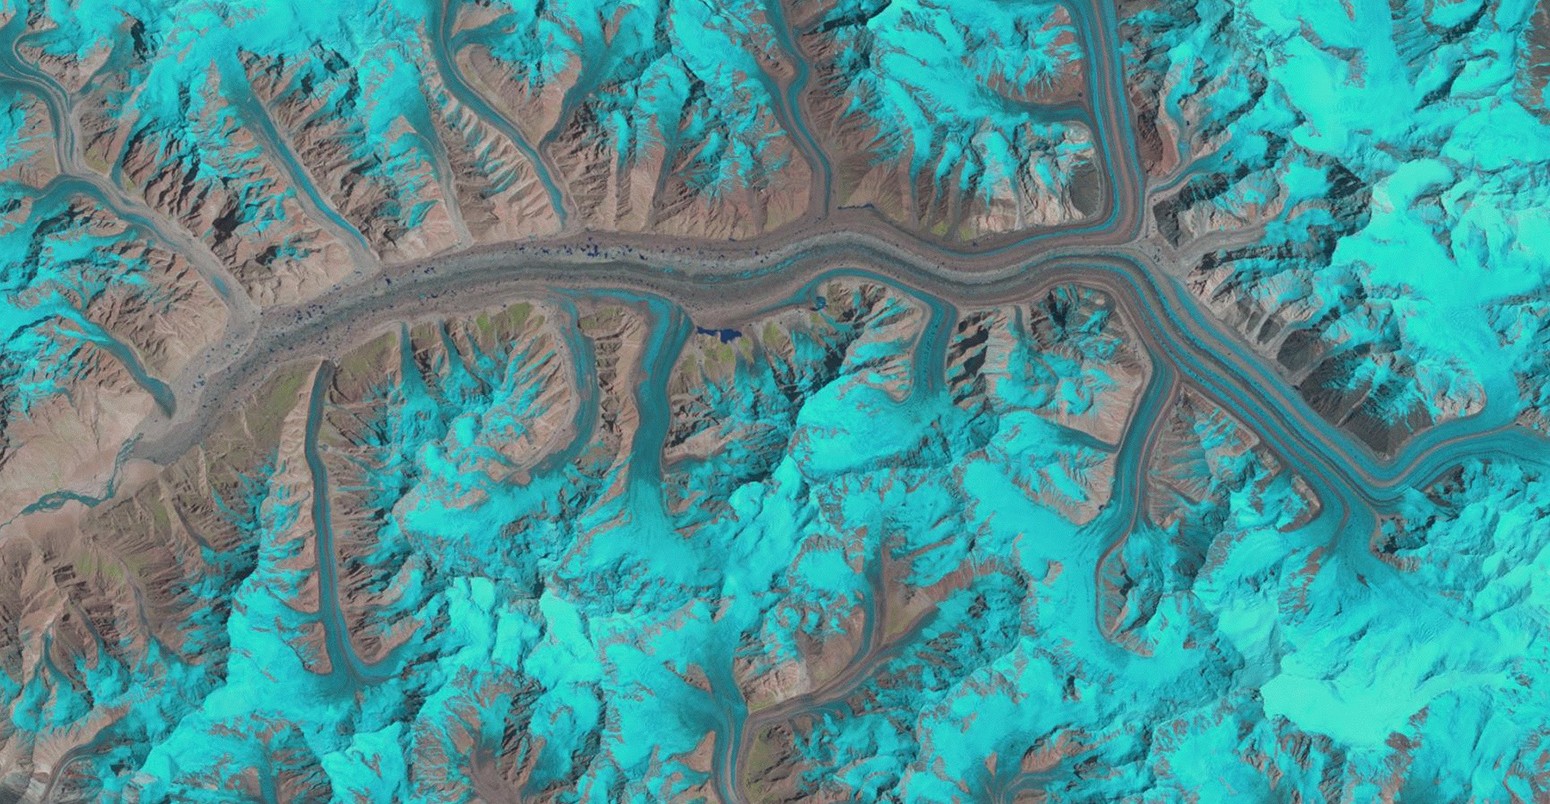
You can see another of these mesmerizing animations below, which compresses 25 years of satellite images of the Baltoro glacier into just a few seconds.
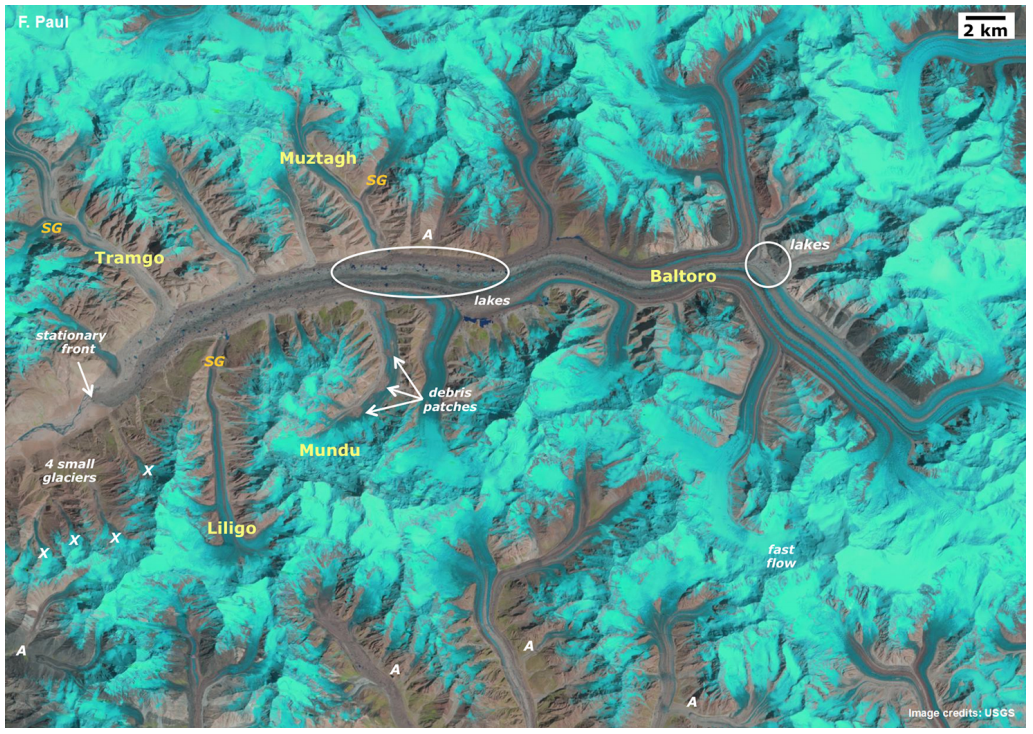
The Baltoro glacier flows from right to left across the middle of the image, with smaller tributary glaciers feeding into it from above and below like streams into a river. The pulsing, bright blue shading shows the fluctuating snow cover on the mountains. Bare terrain is shown in brown, and – if you look really closely – you can see dark blue specs on the glacier, which are lakes of water that form on its surface. Again, the still image below the image should make the features easier to identify.

Animation of the Baltoro glacier and its surrounding tributaries. Glaciers are shown in blue, snow cover in bright blue, clouds in white, water in dark blue, vegetation in green and bare terrain in brown. Source: Paul (2015).

Still image of the Baltoro glacier and their surrounding tributaries. Shows glacier names in orange, actively surging glaciers (orange “SG”) and advancing glaciers (white “A”). Source: Paul (2015)
The study’s author Dr Frank Paul, a senior researcher at the University of Zurich, says turning the static images into an animation makes it easier for the human eye to follow how glaciers flow and notice any changes. He tells Carbon Brief:
We can now see for the first time a large number of surging glaciers in interaction, clearly revealing that there are different types of surges – from fast and short pulses to slow and long-lasting advances – in a small region for glaciers with similar characteristics.
Paul hopes his work will help improve understanding of what triggers these surges and how glaciers in the Karakoram mountain range are changing.
The region’s glaciers are something of an outlier, says Paul, as most are stable or advancing, rather than retreating and shrinking like many around the world. Using animations will help scientists distinguish between a normal glacier melting and a surging glacier surging, he adds.
Credit: Images from Paul (2015) and the USGS, video by Rosamund Pearce for Carbon Brief
Main image: Baltoro glacier and its surrounding tributaries. Credit: Paul (2015).
Paul, F. (2015) Revealing glacier flow and surge dynamics from animated satellite image sequences: examples from the Karakoram, The Cryosphere, doi: 10.5194/tc-9-1-2015
-
Animation: Satellite images of ‘surging’ glaciers in Asia
-
A new study has created a series of animations that capture “surging” glaciers in the Karakoram mountain range in Asia over 25 years, from 1990 to 2015.

