
Analysis: Why scientists think 100% of global warming is due to humans
Zeke Hausfather
12.13.17Zeke Hausfather
13.12.2017 | 4:59pmThe extent of the human contribution to modern global warming is a hotly debated topic in political circles, particularly in the US.
During a recent congressional hearing, Rick Perry, the US energy secretary, remarked that “to stand up and say that 100% of global warming is because of human activity, I think on its face, is just indefensible”.
However, the science on the human contribution to modern warming is quite clear. Humans emissions and activities have caused around 100% of the warming observed since 1950, according to the Intergovernmental Panel on Climate Change’s (IPCC) fifth assessment report.
Here Carbon Brief examines how each of the major factors affecting the Earth’s climate would influence temperatures in isolation – and how their combined effects almost perfectly predict long-term changes in the global temperature.
Carbon Brief’s analysis finds that:
- Since 1850, almost all the long-term warming can be explained by greenhouse gas emissions and other human activities.
- If greenhouse gas emissions alone were warming the planet, we would expect to see about a third more warming than has actually occurred. They are offset by cooling from human-produced atmospheric aerosols.
- Aerosols are projected to decline significantly by 2100, bringing total warming from all factors closer to warming from greenhouse gases alone.
- Natural variability in the Earth’s climate is unlikely to play a major role in long-term warming.
How much warming is caused by humans?
In its 2013 fifth assessment report, the IPCC stated in its summary for policymakers that it is “extremely likely that more than half of the observed increase in global average surface temperature” from 1951 to 2010 was caused by human activity. By “extremely likely”, it meant that there was between a 95% and 100% probability that more than half of modern warming was due to humans.
This somewhat convoluted statement has been often misinterpreted as implying that the human responsibility for modern warming lies somewhere between 50% and 100%. In fact, as NASA’s Dr Gavin Schmidt has pointed out, the IPCC’s implied best guess was that humans were responsible for around 110% of observed warming (ranging from 72% to 146%), with natural factors in isolation leading to a slight cooling over the past 50 years.
Similarly, the recent US fourth national climate assessment found that between 93% to 123% of observed 1951-2010 warming was due to human activities.
These conclusions have led to some confusion as to how more than 100% of observed warming could be attributable to human activity. A human contribution of greater than 100% is possible because natural climate change associated with volcanoes and solar activity would most likely have resulted in a slight cooling over the past 50 years, offsetting some of the warming associated with human activities.
‘Forcings’ that change the climate
Scientists measure the various factors that affect the amount of energy that reaches and remains in the Earth’s climate. They are known as “radiative forcings”.
These forcings include greenhouse gases, which trap outgoing heat, aerosols – both from human activities and volcanic eruptions – that reflect incoming sunlight and influence cloud formation, changes in solar output, changes in the reflectivity of the Earth’s surface associated with land use, and many other factors.
To assess the role of each different forcing in observed temperature changes, Carbon Brief adapted a simple statistical climate model developed by Dr Karsten Haustein and his colleagues at the University of Oxford and University of Leeds. This model finds the relationship between both human and natural climate forcings and temperature that best matches observed temperatures, both globally and over land areas only.
The figure below shows the estimated role of each different climate forcing in changing global surface temperatures since records began in 1850 – including greenhouse gases (red line), aerosols (dark blue), land use (light blue), ozone (pink), solar (yellow) and volcanoes (orange).
The black dots show observed temperatures from the Berkeley Earth surface temperature project, while the grey line shows the estimated warming from the combination of all the different types of forcings.
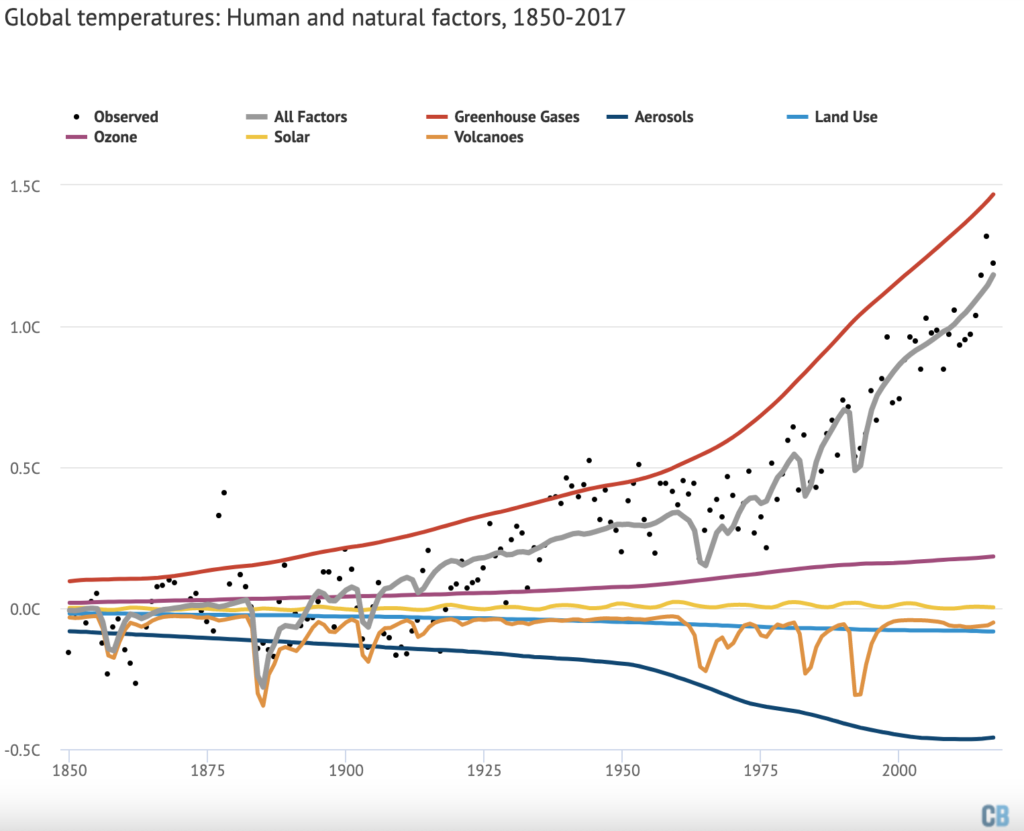
The combination of all radiative forcings generally matches longer-term changes in observed temperatures quite well. There is some year-to-year variability, primarily from El Niño events, that is not driven by changes in forcings. There are also periods from 1900-1920 and 1930-1950 where some larger disagreements are evident between projected and observed warming, both in this simple model and in more complex climate models.
The chart highlights that, of all the radiative forcings analysed, only increases in greenhouse gas emissions produce the magnitude of warming experienced over the past 150 years.
If greenhouse gas emissions alone were warming the planet, we would expect to see about a third more warming than has actually occurred.
So, what roles do all the other factors play?
The extra warming from greenhouse gases is being offset by sulphur dioxide and other products of fossil fuel combustion that form atmospheric aerosols. Aerosols in the atmosphere both reflect incoming solar radiation back into space and increase the formation of high, reflective clouds, cooling the Earth.
Ozone is a short-lived greenhouse gas that traps outgoing heat and warms the Earth. Ozone is not emitted directly, but is formed when methane, carbon monoxide, nitrogen oxides and volatile organic compounds break down in the atmosphere. Increases in ozone are directly attributable to human emissions of these gases.
In the upper atmosphere, reductions in ozone associated with chlorofluorocarbons (CFCs) and other halocarbons depleting the ozone layer have had a modest cooling effect. The net effects of combined lower and upper atmospheric ozone changes have modestly warmed the Earth by a few tenths of a degree.
Changes in the way land is used alter the reflectivity of the Earth’s surface. For example, replacing a forest with a field will generally increase the amount of sunlight reflected back into space, particularly in snowy regions. The net climate effect of land-use changes since 1850 is a modest cooling.
Volcanoes have a short-term cooling effect on the climate due to their injection of sulphate aerosols high into the stratosphere, where they can remain aloft for a few years, reflecting incoming sunlight back into space. However, once the sulphates drift back down to the surface, the cooling effect of volcanoes goes away. The orange line shows the estimated impact of volcanoes on the climate, with large downward spikes in temperatures of up to 0.4C associated with major eruptions.

Finally, solar activity is measured by satellites over the past few decades and estimated based on sunspot counts in the more distant past. The amount of energy reaching the Earth from the sun fluctuates modestly on a cycle of around 11 years. There has been a slight increase in overall solar activity since the 1850s, but the amount of additional solar energy reaching the Earth is small compared to other radiative forcings examined.
Over the past 50 years, solar energy reaching the Earth has actually declined slightly, while temperatures have increased dramatically.
Human forcings match observed warming
The accuracy of this model depends on the accuracy of the radiative forcing estimates. Some types of radiative forcing like that from atmospheric CO2 concentrations can be directly measured and have relatively small uncertainties. Others, such as aerosols, are subject to much greater uncertainties due to the difficulty of accurately measuring their effects on cloud formation.
These are accounted for in the figure below, which shows combined natural forcings (blue line) and human forcings (red line) and the uncertainties that the statistical model associates with each. These shaded areas are based on 200 different estimates of radiative forcings, incorporating research attempting to estimate a range of values for each. Uncertainties in human factors increase after 1960, driven largely by increases in aerosol emissions after that point.
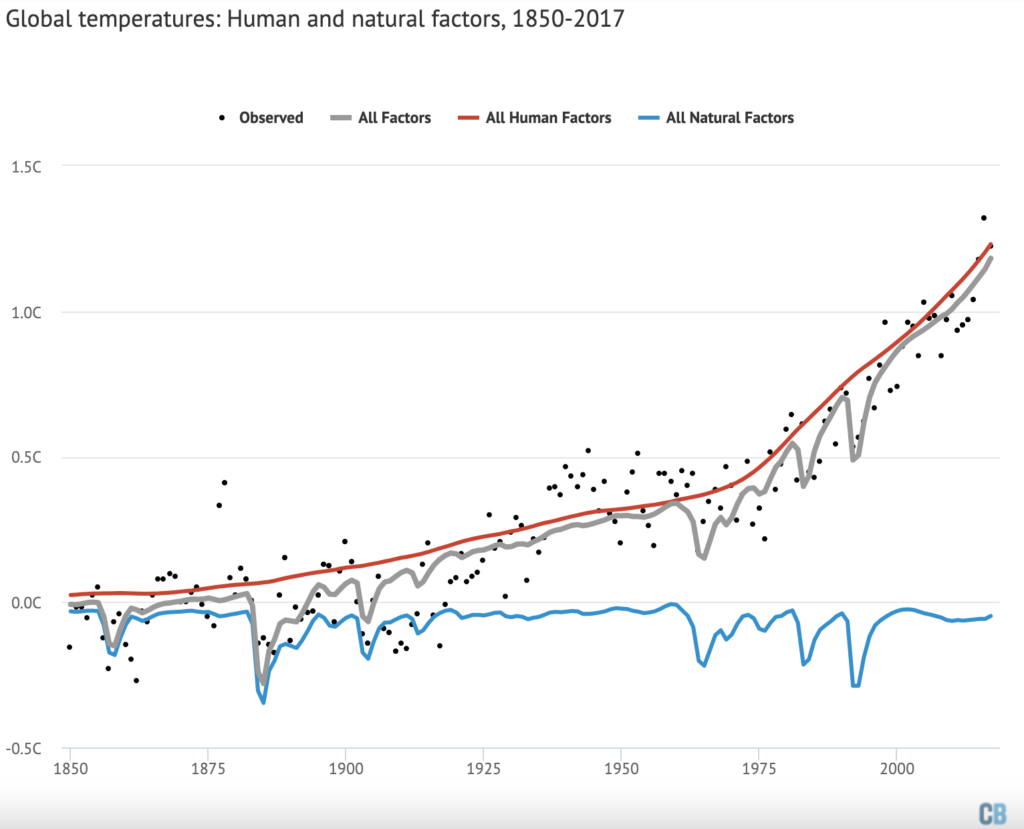
Overall, warming associated with all human forcings agrees quite well with observed warming, showing that about 104% of the total since the start of the “modern” period in 1950 comes from human activities (and 103% since 1850), which is similar to the value reported by the IPCC. Combined natural forcings show a modest cooling, primarily driven by volcanic eruptions.
The simple statistical model used for this analysis by Carbon Brief differs from much more complex climate models generally used by scientists to assess the human fingerprint on warming. Climate models do not simply “fit” forcings to observed temperatures. Climate models also include variations in temperature over space and time, and can account for different efficacies of radiative forcings in different regions of the Earth.
However, when analysing the impact of different forcings on global temperatures, complex climate models generally find results similar to simple statistical models. The figure below, from the IPCC’s Fifth Assessment Report, shows the influence of different factors on temperature for the period from 1950 to 2010. Observed temperatures are shown in black, while the sum of human forcings is shown in orange.
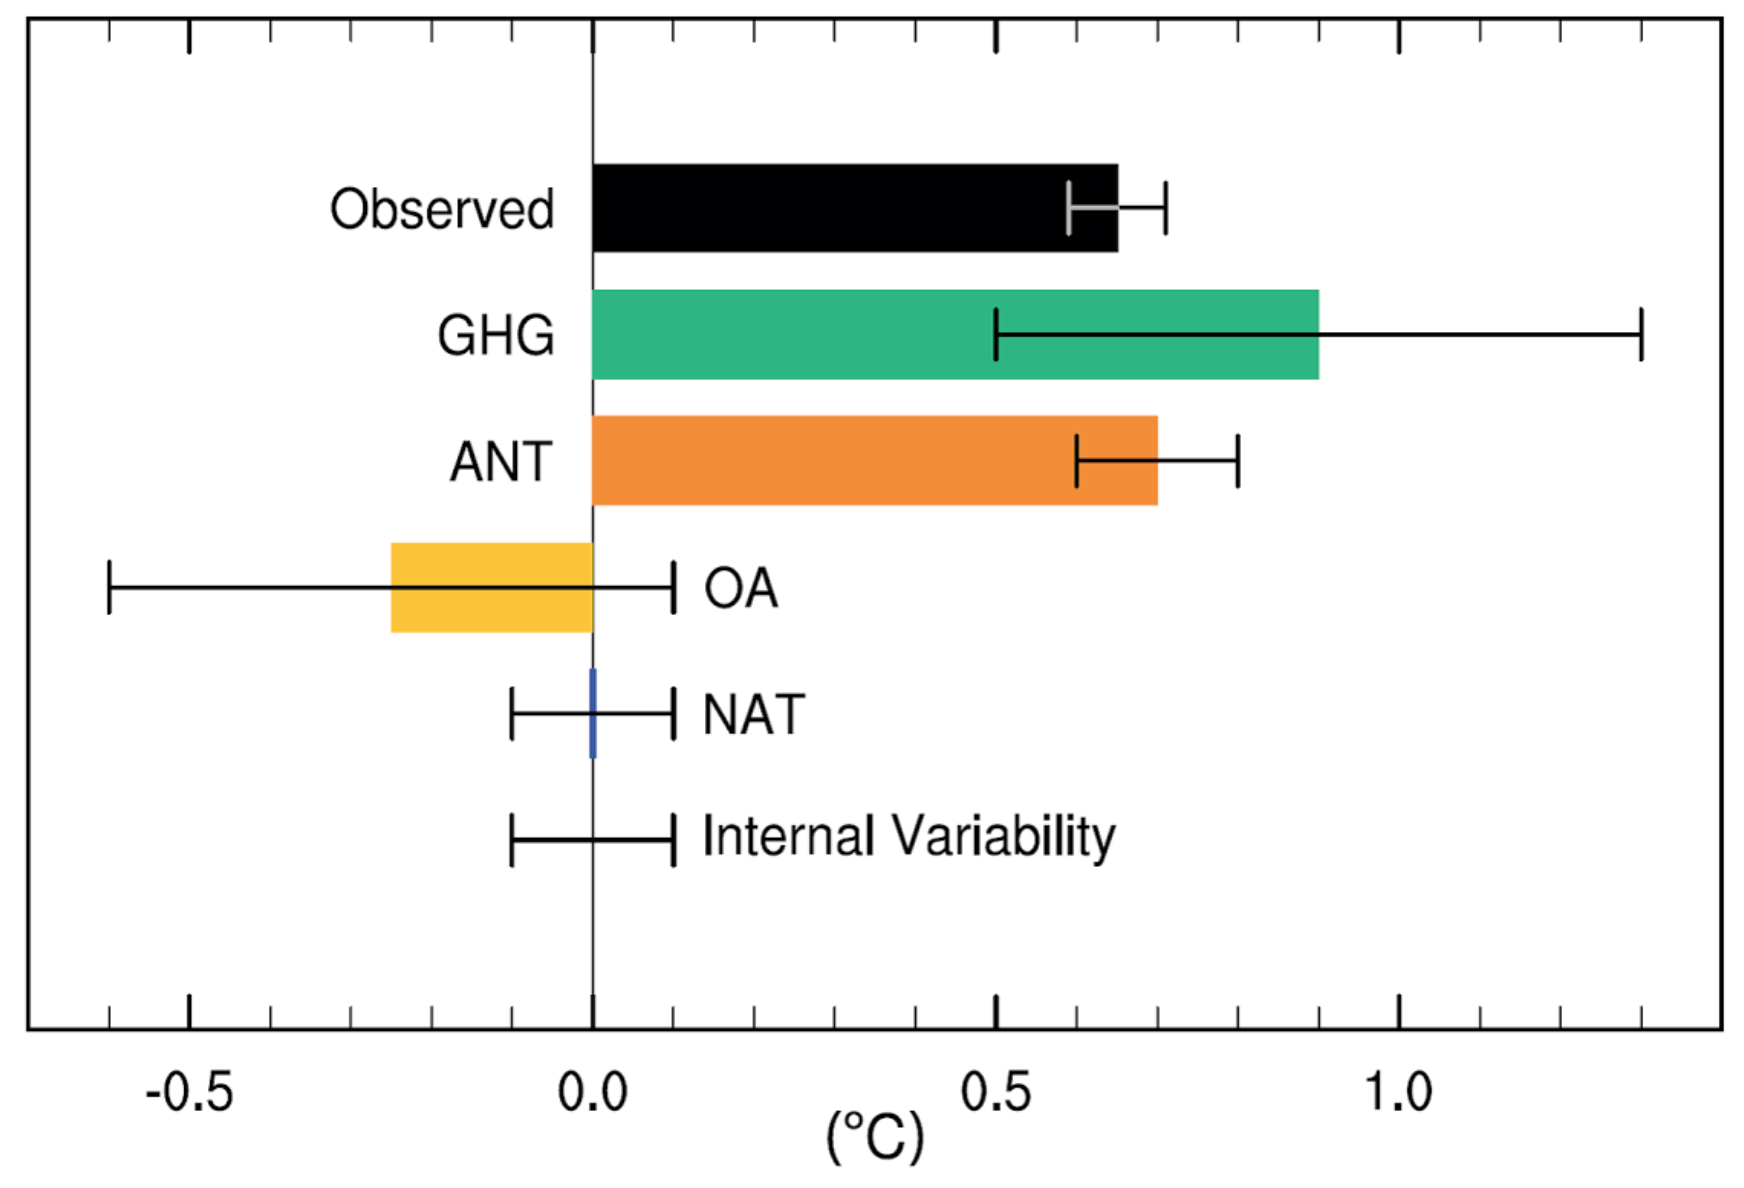
This suggests that human forcings alone would have resulted in approximately 110% of observed warming. The IPCC also included the estimated magnitude of internal variability over that period in the models, which they suggest is relatively small and comparable to that of natural forcings.
As Prof Gabi Hegerl at the University of Edinburgh tells Carbon Brief: “The IPCC report has an estimate that basically says the best guess is no contribution [from natural variability] with not that much uncertainty.”
Land areas are warming faster
Land temperatures have warmed considerably faster than average global temperatures over the past century, with temperatures reaching around 1.7C above pre-industrial levels in recent years. The land temperature record also goes back further in time than the global temperature record, though the period prior to 1850 is subject to much greater uncertainties.
Both human and natural radiative forcings can be matched to land temperatures using the statistical model. The magnitude of human and natural forcings will differ a bit between land and global temperatures. For example, volcanic eruptions appear to have a larger influence on land, as land temperatures are likely to respond faster to rapid changes in forcings.
The figure below shows the relative contribution of each different radiative forcing to land temperatures since 1750.
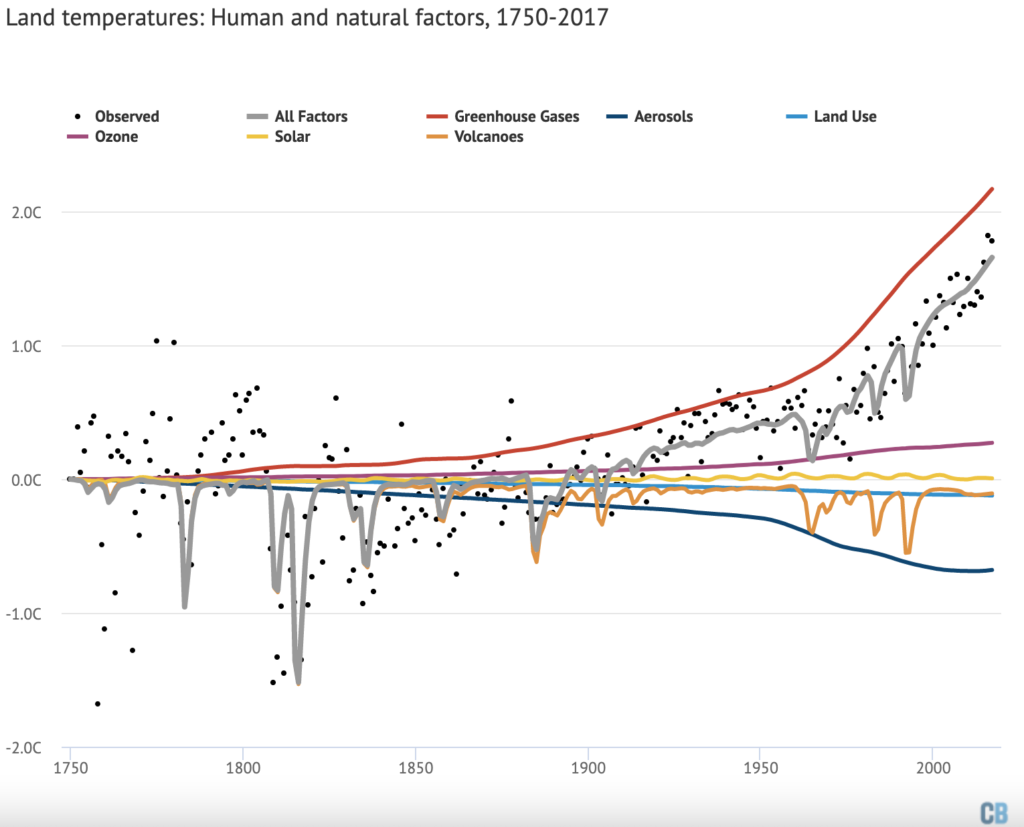
The combination of all forcings generally matches observed temperatures quite well, with short-term variability around the grey line primarily driven by El Niño and La Niña events. There is a wider variation in temperatures prior to 1850, reflecting the much larger uncertainties in the observational records that far back.
There is still a period around 1930 and 1940 where observations exceed what the model predicts, though the differences are less pronounced than in global temperatures and the 1900-1920 divergence is mostly absent in land records.
Volcanic eruptions in the late 1700s and early 1800s stand out sharply in the land record. The eruption of Mount Tambora in Indonesia in 1815 may have cooled land temperatures by a massive 1.5C, though records at the time were limited to parts of the Northern Hemisphere and it is, therefore, hard to draw a firm conclusion about global impacts. In general, volcanoes appear to cool land temperatures by nearly twice as much as global temperatures.
What may happen in the future?
Carbon Brief used the same model to project future temperature changes associated with each forcing factor. The figure below shows observations up to 2017, along with future post-2017 radiative forcings from RCP6.0, a medium-to-high future warming scenario.
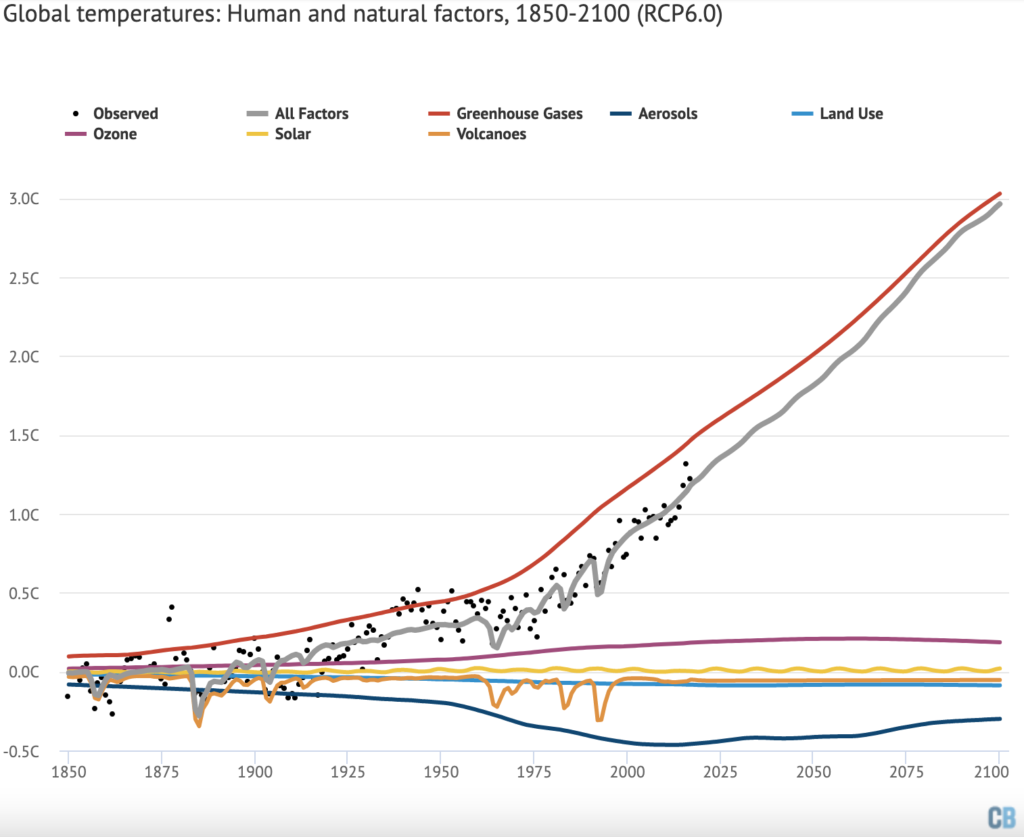
When provided with the radiative forcings for the RCP6.0 scenario, the simple statistical model shows warming of around 3C by 2100, nearly identical to the average warming that climate models find.
Future radiative forcing from CO2 is expected to continue to increase if emissions rise. Aerosols, on the other hand, are projected to peak at today’s levels and decline significantly by 2100, driven in large part by concerns about air quality. This reduction in aerosols will enhance overall warming, bringing total warming from all radiative forcing closer to warming from greenhouse gases alone. The RCP scenarios assume no specific future volcanic eruptions, as the timing of these is unknowable, while solar output continues its 11-year cycle.
This approach can also be applied to land temperatures, as shown in the figure below. Here, land temperatures are shown between 1750 and 2100, with post-2017 forcings also from RCP6.0.
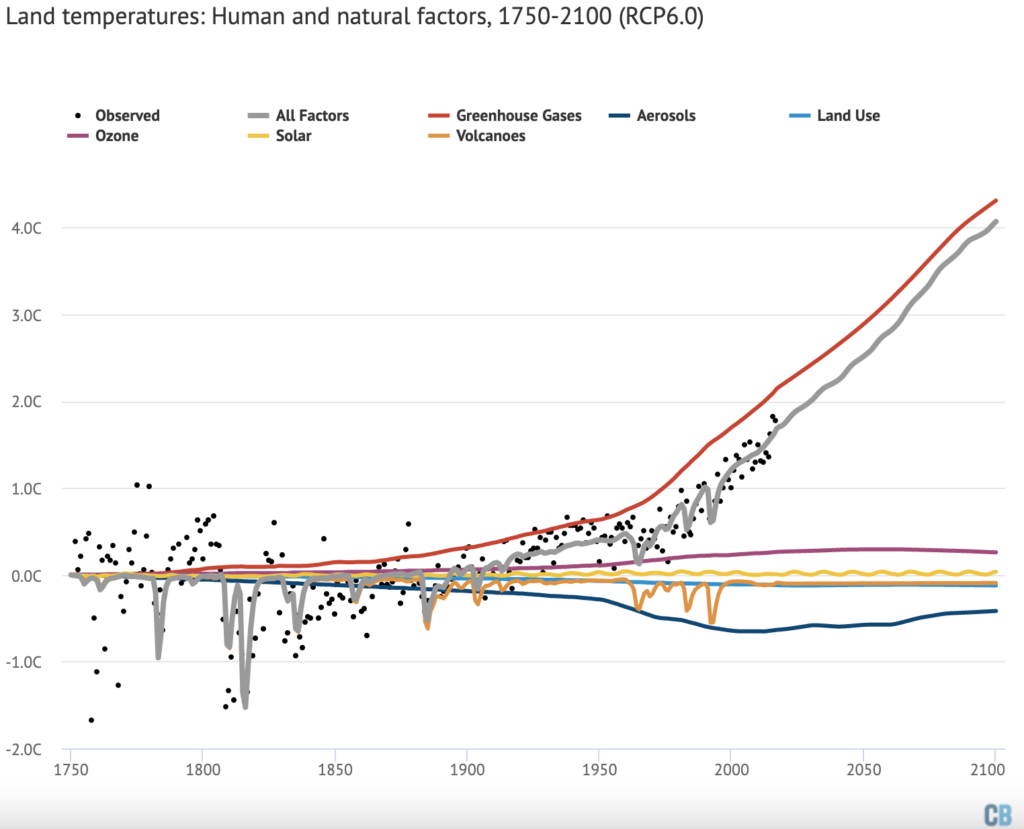
The land is expected to warm about 30% faster than the globe as a whole, as the rate of warming over the oceans is buffered by ocean heat uptake. This is seen in the model results, where land warms by around 4C by 2100 compared to 3C globally in the RCP6.0 scenario.
There is a wide range of future warming possible from different RCP scenarios and different values for the sensitivity of the climate system, but all show a similar pattern of declining future aerosol emissions and a larger role for greenhouse gas forcing in future temperatures.
The role of natural variability
While natural forcings from solar and volcanoes do not seem to play much of a role in long-term warming, there is also natural variability associated with ocean cycles and variations in ocean heat uptake.
As the vast majority of energy trapped by greenhouse gases is absorbed by the oceans rather than the atmosphere, changes in the rate of ocean heat uptake can potentially have large impacts on the surface temperature. Some researchers have argued that multidecadal cycles, such as the Atlantic Multidecadal Oscillation (AMO) and Pacific Decadal Oscillation (PDO), can play a role in warming at a decadal scale.
While human factors explain all the long-term warming, there are some specific periods that appear to have warmed or cooled faster than can be explained based on our best estimates of radiative forcing. For example, the modest mismatch between the radiative forcing-based estimate and observations during the mid-1900s might be evidence of a role for natural variability during that period.
A number of researchers have examined the potential for natural variability to impact long-term warming trends. They have found that it generally plays a limited role. For example, Dr Markus Huber and Dr Reto Knutti at the Institute for Atmospheric and Climate Science (IAC) in Zurich found a maximum possible contribution of natural variability of around 26% (+/- 12%) over the past 100 years and 18% (+/- 9%) over the past 50 years.
Knutti tells Carbon Brief:
“We can never completely rule out that natural variability is larger than we currently think. But that is a weak argument: you can, of course, never rule out the unknown unknown. The question is whether there is strong, or even any evidence for it. And the answer is no, in my view.
Models get the short-term temperature variability approximately right. In many cases, they even have too much. And for the long term, we can’t be sure because the observations are limited. But the forced response pretty much explains the observations, so there is no evidence from the 20th century that we are missing something…
Even if models were found to underestimate internal variability by a factor of three, it is extremely unlikely [less than 5% chance] that internal variability could produce a trend as large as observed.”
Similarly, Dr Martin Stolpe and colleagues, also at IAC, recently analysed the role of multidecadal natural variability in both the Atlantic and Pacific oceans. They found that “less than 10% of the observed global warming during the second half of the 20th century is caused by internal variability in these two ocean basins, reinforcing the attribution of most of the observed warming to anthropogenic forcings”.
Internal variability is likely to have a much larger role in regional temperatures. For example, in producing unusually warm periods in the Arctic and the US in the 1930s. However, its role in influencing long-term changes in global surface temperatures appears to be limited.
Conclusion
While there are natural factors that affect the Earth’s climate, the combined influence of volcanoes and changes in solar activity would have resulted in cooling rather than warming over the past 50 years.
The global warming witnessed over the past 150 years matches nearly perfectly what is expected from greenhouse gas emissions and other human activity, both in the simple model examined here and in more complex climate models. The best estimate of the human contribution to modern warming is around 100%.
Some uncertainty remains due to the role of natural variability, but researchers suggest that ocean fluctuations and similar factors are unlikely to be the cause of more than a small fraction of modern global warming.
Methodology
The simple statistical model used in this article is adapted from the Global Warming Index published by Haustein et al (2017). In turn, it is based on the Otto et al (2015) model.
The model estimates contributions to observed climate change and removes the impact of natural year-to-year fluctuations by a multiple linear regression of observed temperatures and estimated responses to total human-induced and total natural drivers of climate change. The forcing responses are provided by the standard simple climate model given in Chapter 8 of IPCC (2013), but the size of these responses is estimated by the fit to the observations. The forcings are based on IPCC (2013) values and were updated to 2017 using data from NOAA and ECLIPSE. 200 variations of these forcings were provided by Dr. Piers Forster of the University of Leeds, reflecting the uncertainty in forcing estimates. An Excel spreadsheet containing their model is also provided.
The model was adapted by calculating forcing responses for each of the different major climate forcings rather than simply total human and natural forcings, using the Berkeley Earth record for observations. The decay time of thermal response used in converting forcings to forcing responses was adjusted to be one year rather than four years for volcanic forcings to better reflect the fast response time present in observations. The effects of El Niño and La Niña (ENSO) events was removed from the observations using an approach adapted from Foster and Rahmstorf (2011) and the Kaplan El Niño 3.4 index when calculating the volcanic temperature response, as the overlap between volcanoes and ENSO otherwise complicates empirical estimates.
The temperature response for each individual forcing was calculated by scaling their forcing responses by the total human or natural coefficients from the regression model. The regression model was also run separately for land temperatures. Temperature responses for each forcing between 2018 and 2100 were estimated using forcing data from RCP6.0, normalised to match the magnitude of observed forcings at the end of 2017.
Uncertainties in total human and total natural temperature response was estimated using a Monte Carlo analysis of 200 different forcing series, as well as the uncertainties in the estimated regression coefficients. The Python code used to run the model is archived with GitHub and available for download.
Observational data from 2017 shown in the figures is based on the average of the first 10 months of the year and is likely to be quite similar to the ultimate annual value.

