Analysis: Record surge of clean energy in 2024 halts China’s CO2 rise
Lauri Myllyvirta
01.27.25Lauri Myllyvirta
27.01.2025 | 12:01amA record surge of clean energy kept China’s carbon dioxide (CO2) emissions below the previous year’s levels in the last 10 months of 2024.
However, the new analysis for Carbon Brief, based on official figures and commercial data, shows the tail end of China’s rebound from zero-Covid in January and February, combined with abnormally high growth in energy demand, stopped CO2 emissions falling in 2024 overall.
While China’s CO2 output in 2024 grew by an estimated 0.8% year-on-year, emissions were lower than in the 12 months to February 2024.
Other key findings of the analysis include:
- China’s CO2 emissions grew 0.6% year-on-year in the fourth quarter, as hopes of stimulus measures pushed up industrial coal use and oil demand.
- In addition, wind and solar fell short of expected levels in the final quarter of 2024, likely as a result of being denied grid access in favour of coal power, which was flat year-on-year.
- Clean-energy capacity growth will accelerate in 2025 as largescale wind, solar and nuclear projects race to finish before the 14th five-year plan period comes to an end.
- Industrial electricity demand growth has slowed since summer 2024 and total energy demand growth eased in the fourth quarter of the year.
- These factors would be expected to push China’s coal-power output into decline in 2025, which would have international significance for energy markets and emissions.
- However, another period of industrial demand growth driven by government stimulus efforts could change this picture, particularly if the real-estate slump turns around.
As ever, the latest analysis shows that policy decisions made in 2025 will strongly affect China’s emissions trajectory in the coming years. In particular, both China’s new commitments under the Paris Agreement and the country’s next five-year plan are being prepared in 2025.In particular, both China’s new commitments under the Paris Agreement and the country’s next five-year plan are being prepared in 2025.
Emissions have plateaued since February 2024
China’s re-opening from zero-Covid began in earnest in March 2023, leading to rapid energy demand growth year-on-year until February 2024.
This resulted in a 3.8% rise in China’s CO2 emissions in the first quarter of 2024.
Emissions stabilised in March-December 2024 as clean electricity supply growth covered all of the growth in electricity demand, while emissions from cement and steel production fell due to contracting demand for construction materials. This is shown in the figure below.
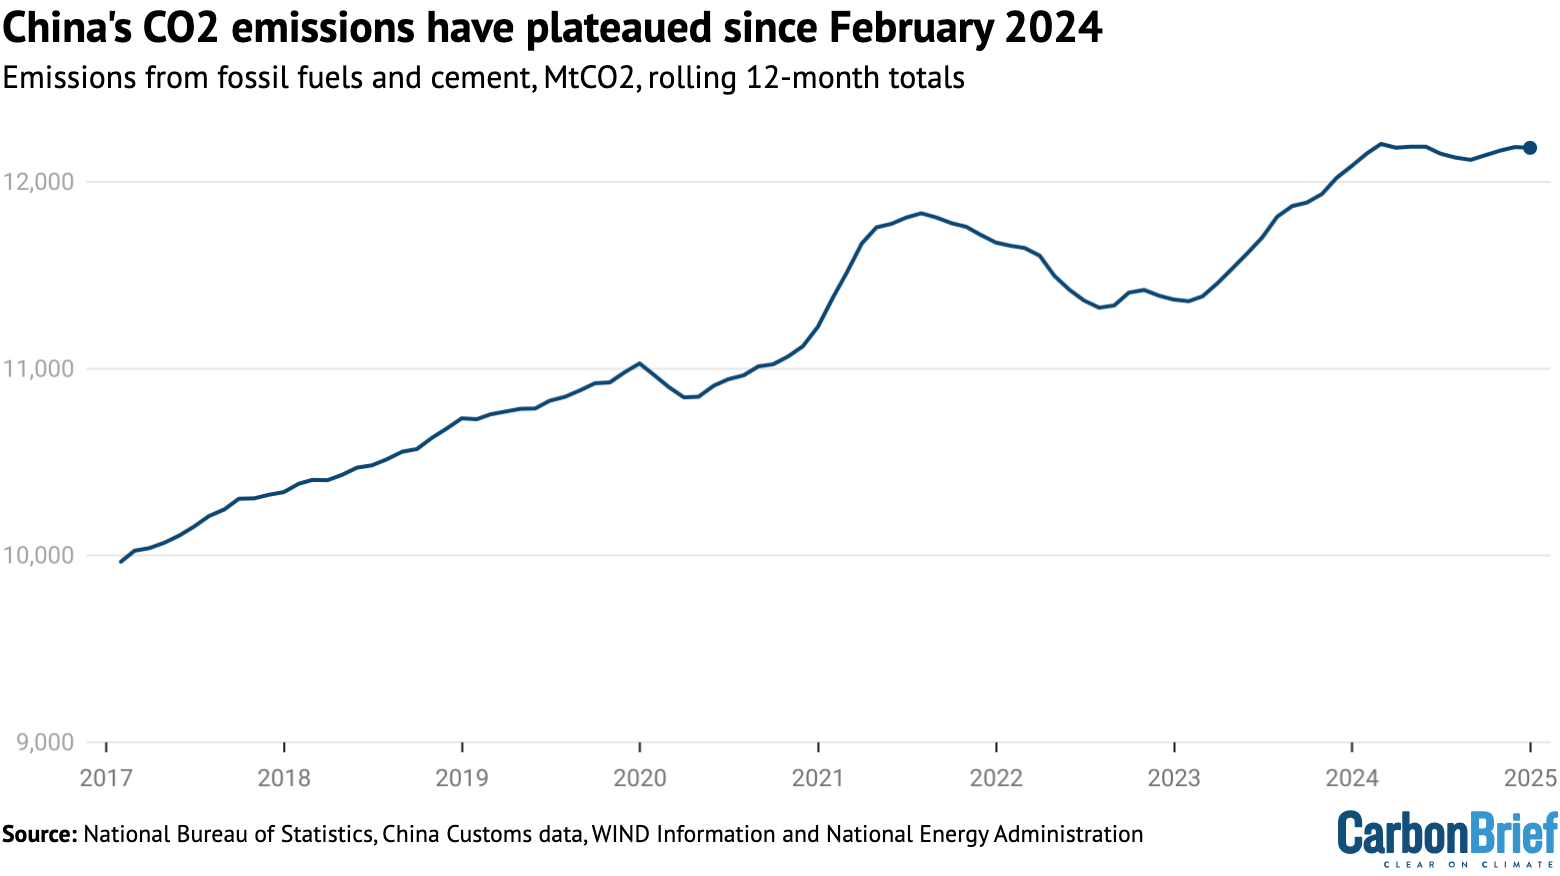
After February 2024, oil consumption growth also stabilised. Coal use in the chemical industry and coal and gas use in other industrial sectors continued to grow, offsetting the fall in emissions from the construction materials industry.
Contributions to the emissions plateau during the final 10 months of 2024 are shown in the figure below, broken down by fuel and by sector, where data is available.

The growth in power generation from non-fossil sources set a new record, growing more than 500 terawatt hours (TWh) compared with 2023, which had already been a record year.
This is more than the total power generation of Germany in 2023. Solar power generation was responsible for half of the increase in clean power supply.
Emissions inched up in the fourth quarter
After rising in the first quarter of 2024, China’s CO2 emissions started to decline in March, falling 1% in the second quarter of the year and levelling off in the third quarter.
While power-sector emissions remained stable in the fourth quarter, industrial emissions outside the power sector swung into an increase. There was no reduction in power-sector emissions to offset that growth, resulting in an estimated 0.6% increase in overall emissions.
The largest factor was a rebound in oil and gas demand outside the power sector, indicated by the large bars under “All Sectors” and “Other Sectors” in the figure below.
Preliminary numbers from the National Bureau of Statistics indicate gas and oil demand rose 10% and 3% year-on-year, respectively, in the fourth quarter of 2024.
The supply of refined oil products fell 1.5%, so the increase in oil demand apparently came entirely from crude oil consumption in the chemical industry.
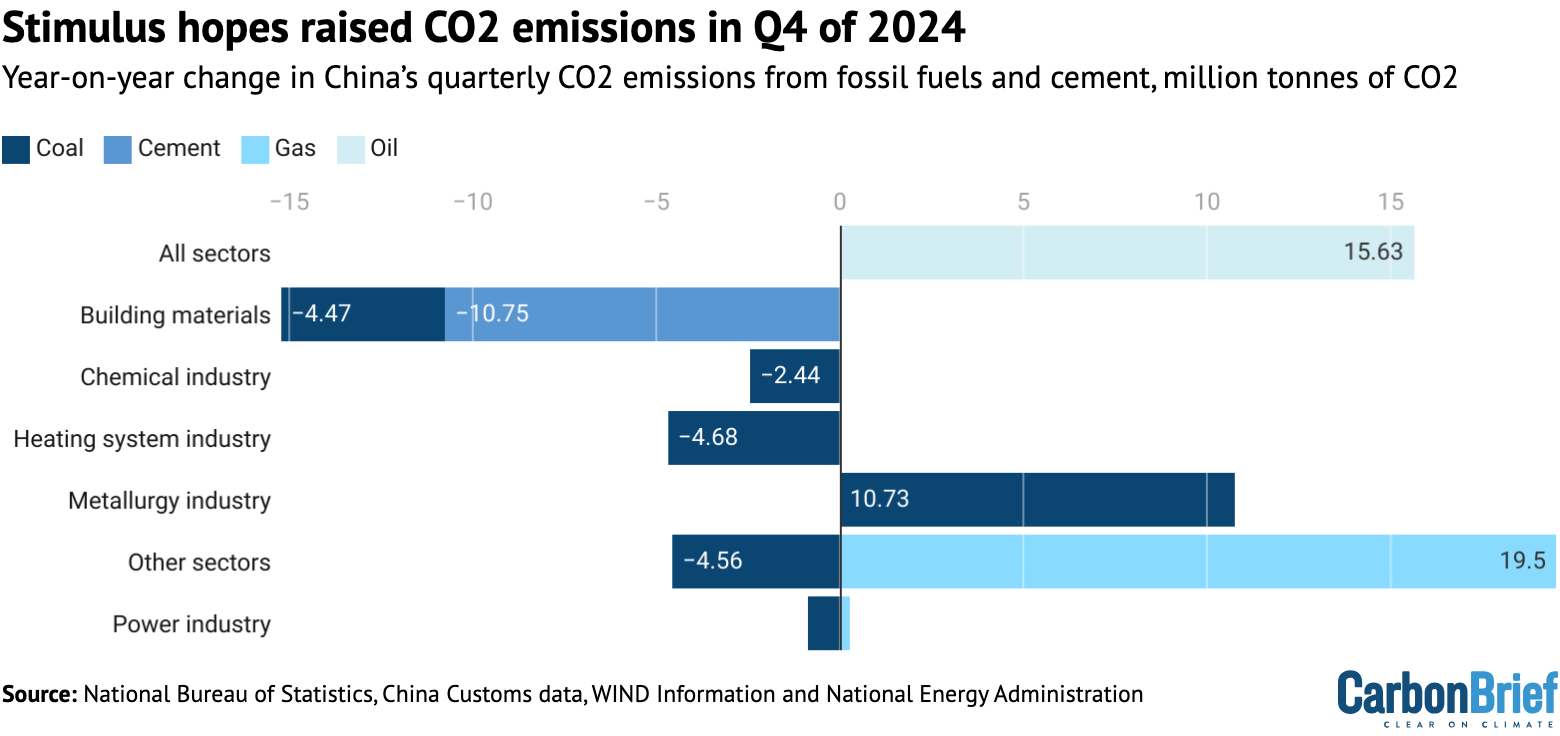
Steel output picked up after stimulus announcements in late September, increasing 2% in October-November and 12% in December after a 4% reduction in the year to September.
The December increase, however, came from the reversal of a sharp 15% drop in production in December 2023, which was a last-minute measure to adhere to a cap set by the government for steel production during the year. As a result, steel production in December 2024 saw a dramatic increase year-on-year, but remained below 2022 levels.
Gas consumption has been rebounding from a drop caused by spiking prices in 2022, but demand growth is expected to moderate this year.
Cement production fell 6% year-on-year in the last quarter, extending a decline that started in 2020 and that has seen China’s cement output fall by almost a quarter from its peak level, as construction volumes have fallen.
Clash between coal and clean energy
As shown in the chart above, emissions from the power sector remained flat during the fourth quarter of 2024, with a small fall from coal and a small rise from gas. However, as electricity demand growth slowed down to 3.5%, emissions would have been expected to fall.
Even as electricity demand growth slowed down in October and November, fossil-fuel generation continued to increase. This was due to a sharp drop in the utilisation of solar and wind capacity, as shown by China Electricity Council data accessed through Wind Financial Terminal.
It is normal for utilisation to vary month-to-month, especially in the case of wind power, as wind conditions vary. The fall in utilisation of solar power was, however, the largest on record and, in the case of both solar and wind, this specific drop is not readily explained by weather conditions.
If the fall in utilisation was not caused by weather, the other possible cause is an increase in curtailment, or the amount of solar and wind power supply not fed into the power grid.
However, officially reported curtailment rates only increased marginally.
The apparent increase in unreported solar and wind curtailment in November is indicative of issues likely to arise in China’s electricity market as demand for coal-fired power begins to fall.
The government has pushed electricity buyers to enter into long-term contracts with coal-power companies, which involve guaranteed sales volumes. This has been a way to shore up profitability and enable investments in new coal-power capacity.
This now appears to be coming into conflict with clean-power growth and efforts to limit emissions.
When power generation from clean sources grows faster or total power demand grows slower than expected, electricity buyers with these long-term contracts can face penalties, unless they refuse power supply from clean sources and purchase from coal-power generators instead.
This conflict is accentuated when a lot of new coal-power capacity enters into the market. The new units have internal production targets and, at least in some cases, power purchase agreements signed in advance, making them unwilling to reduce output, even if there is no space in the grid.
It is notable that the first time that renewable energy curtailment became a major issue in China was around 2015, when demand for power generation from coal was falling.
Statistical analysis also reveals that solar and wind capacity utilisation tends to fall when coal-power capacity utilisation falls as well – the opposite of what should be expected. In a well-functioning market, coal-power utilisation should fall when more clean power is available.
A statistical model predicting solar and wind power utilisation by province, using daily meteorological data, failed to predict the drop in utilisation in October and November, indicating that weather conditions were not the main reason for the reduction.
If power demand growth slows down in 2025 and the expected record clean-energy additions are realised (see below), the conflict between coal and clean power could worsen. Demand for coal-fired power would be likely to fall, even as the coal industry expects rapid growth.
It would only be possible to ease this conflict by relaxing the government’s targets for long-term power contracts and accepting a fall in the utilisation of coal-power capacity.
Did emissions peak in 2024?
A year ago, an earlier iteration of this analysis predicted that China’s emissions would begin to fall in March 2024 and then continue to decline, leading to a 2% reduction in the full year of 2024.
This was based on three assumptions:
- Clean-energy additions would continue;
- Hydropower generation would recover to historical average levels;
- Energy consumption growth would slow down, after abnormally rapid growth in 2020-2023, during and after zero-Covid.
Taking each of those assumptions in turn, clean-energy additions not just continued but accelerated further, with 2024 poised to see a new record for the amount of solar and wind capacity added. Hydropower also recovered, although not all the way to historical averages.
The clean-energy additions, shown by the columns in the figure below, reached a scale where they would be sufficient to cover all energy demand growth at historical pre-Covid levels (grey line).
Indeed, the growth in clean-energy supply in 2024 far exceeded the growth in total energy demand recorded in any year from 2015 to 2020. However, energy demand growth in 2023-2024 was above historical norms, increasing significantly faster than in the years before Covid, even as GDP growth rates slowed down, due to high reliance on energy intensive industries to drive growth.

Specifically, China’s power demand grew at 6.8% in 2024 while GDP expanded 5%. In contrast, last year’s analysis had assumed that power demand and GDP growth rates would converge after the zero-Covid period and its immediate aftermath were over.
This discrepancy was enough to throw off the projection for 2024. With energy demand growth far in excess of what had been assumed, even the massive clean-energy additions seen in 2024 were only enough to stabilise emissions, rather than to reduce them.
This means that while China’s CO2 emissions have been stable since March, it is still likely that they will post a small increase of around 0.8% for the full year, as January-February had rapid growth due to the rebound from zero-Covid.
As a result, the calendar year of 2023 did not become the peak year for China’s CO2 output, because emissions still inched up, according to current estimates.
From one perspective, stabilising emissions despite the rapid growth in energy demand is a major achievement. From another perspective, it is important for China’s emissions to begin to fall in absolute terms, if global climate goals are to remain within reach.
Even larger clean energy additions likely in 2025
After the enormous jump in China’s clean-energy installations in 2023 – particularly solar – even the most optimistic predictions did not expect a further increase in 2024.
Yet solar and wind capacity additions in China increased by 28% and 5% year-on-year in 2024, respectively, with 277GW of solar and 79GW of wind connected to the grid.
This year is likely to set another record, as key largescale solar, wind and nuclear projects race to complete during the 14th five-year plan period ending in 2025. State-owned enterprises, local governments and other actors have set targets that they will be striving to achieve.
Solar-power capacity additions are expected to stay at the record levels seen in 2024, with approximately 265GW added to the grid, according to forecasts from TrendForce New Energy Research Center.
Wind power is poised for a new record of 110-120GW of capacity added in 2025, according to China International Capital Corporation. Of this, 14-17GW is expected to be offshore wind power, up from 7GW in 2024.
After two slow years, China’s nuclear power capacity is expected to see a significant increase, rising to 65GW by the end of 2025, from 61GW today.
Some 3GW was added right at the end of 2024, starting to contribute to non-fossil power supply in 2025. In total, after a record number of new reactor projects was permitted in 2023 and 2024, China currently has 55GW approved or under construction, suggesting an average of more than 10GW of reactor start-ups per year over the next five years.
In addition, China had at least 14GW of conventional hydropower under construction at the end of 2024, based on Global Energy Monitor data on capacity under construction in April 2024 and subtracting capacity that was already commissioned last year.
Taken together, the new solar, wind, hydro and nuclear capacity that is likely to be connected to China’s grid in 2025 can be expected to generate more than 600TWh per year of electricity, up from the 500TWh of new clean electricity generation added in 2024, as shown in the figure below.

However, as noted above, new clean-power capacity will only result in lower coal-fired generation and CO2 emissions if its output is integrated into the electricity system without a major increase in curtailment.
Aiming to avoid that outcome, in early January 2025, China’s top economic planner, the National Development and Reform Commission (NDRC), published a new power system action plan that aims to integrate more than 200GW of new wind and solar onto the grid per year in 2025-27.
While this target is below the record-breaking clean-energy additions seen in recent years, it still indicates that there is central government support for similarly rapid growth in the next few years.
In December 2024, top economic policymakers called for accelerating the construction of very largescale clean-energy “bases” in western China and introduced a new theme of creating zero-carbon industrial parks. As industrial parks are responsible for 30% of China’s CO2 emissions, this policy could also drive significant investment in clean energy.
Energy demand outlook
Whether China’s emissions remain stable or begin to fall, cementing an emissions peak, remains a race between clean-energy additions and energy demand growth.
The big question is whether the recent trend of exceptionally rapid energy demand growth will continue, or whether it will unwind, resulting in a period of demand growing slower than GDP.
The previous periods of rapid energy and power demand growth in relation to GDP, around 2004 and 2010, were followed by periods of slower demand growth. In particular, around 2015, energy demand growth slowed down markedly and China’ emissions plateaued for several years.
There are signs of a repeat of this pattern in China’s recent energy demand data.
Specifically, industrial power demand rose sharply in 2023 and 2024, but exhibited a clear slowdown in the second half of 2024, as shown in the figure below (top left).
This was masked by a rebound in service and residential sector electricity consumption. Residential demand merely caught up to the pre-Covid trendline and service sector demand remains below it, reflecting the Covid-era distortion to the structure of the economy.

The recent rapid energy demand growth has been driven by an economic strategy that heavily favours energy-intensive manufacturing.
This approach has likely reached its limits as China’s manufacturing expansion has led to a supply glut, falling prices for industrial products and falling profits.
Now, the government is aiming to speed up economic growth by stimulating household consumption, a much less energy-intensive part of the economy than manufacturing, and by “halting the decline and stabilising” the real-estate sector.
However, delivering this outcome is far from trivial. The 2022 economic work conference – where annual departmental priorities are set – had also said that the recovery from zero-Covid should be consumption-led, but this vision failed to materialise.
The 2024 conference reduced the emphasis on “high-quality growth”, a concept that discourages growth driven by “low-quality” construction projects. In Communist party jargon, it said that “the relationship between improving the quality and growing the total output must be well coordinated”. This was a downgrade from 2023 when “high-quality growth” was described as a “hard truth”.
What next for energy and emissions in China?
Clean-energy additions will accelerate even further this year, from the record levels of 2024. At the same time, industrial power demand growth has slowed significantly since the summer.
These two trends suggest there is likely to be a fall in power-sector emissions this year. However, this drop in CO2 could still be outweighed by government stimulus efforts leading to another period of rapid growth in heavy industry, especially if construction volumes rebound.
If construction activity makes a strong comeback, this could drive further increases in emissions. The coal industry is bullish, with the China Coal Transportation and Distribution Association projecting a 1% increase in coal consumption in 2025.
The China Coal Industry Association projects a 4.5% increase in power generation from coal and gas. It believes that the stimulus policies to expand investment and stabilise the real-estate market will lead to increases in output in steel, cement and other major coal-consuming industries.
However, even if policymakers did pursue construction stimulus, a key question is how much of an effect it will have – and how fast.
Regardless of industry association hopes, the government’s stimulus announcements, so far, have not reversed market expectations of falling steel demand.
The local governments that are expected to deliver the stimulus are likely to struggle to fund a major increase in spending – and there is much less need for new infrastructure than during previous stimulus cycles.
If the government is successful in reviving household consumption as a source of growth – which is far less energy intensive – then energy demand growth could normalise to levels where clean energy can easily meet all of the growth. If so, emissions would begin to fall in a sustained way.
Beyond 2025, China’s energy and emissions trends are harder to pin down. For example, the rate of clean-energy additions after this year is more uncertain, despite recent positive signals.
China’s new Paris commitments are due to be published this year, containing targets for 2030 and 2035. In addition, the 15th five-year plan, covering 2026-2030, will be prepared this year and released in early 2026. As such, policy decisions made in 2025 will strongly affect China’s emissions trajectory not only this year, but for many years into the future.
About the data
Data for the analysis was compiled from the National Bureau of Statistics of China, National Energy Administration of China, China Electricity Council and China Customs official data releases, and from WIND Information, an industry data provider.
Wind and solar output, and thermal power breakdown by fuel, was calculated by multiplying power generating capacity at the end of each month by monthly utilisation, using data reported by China Electricity Council through Wind Financial Terminal.
Total generation from thermal power and generation from hydropower and nuclear power was taken from National Bureau of Statistics monthly releases.
Monthly utilisation data was not available for biomass, so the annual average of 52% for 2023 was applied. Power sector coal consumption was estimated based on power generation from coal and the average heat rate of coal-fired power plants during each month, to avoid the issue with official coal consumption numbers affecting recent data.
When data was available from multiple sources, different sources were cross-referenced and official sources used when possible, adjusting total consumption to match the consumption growth and changes in the energy mix reported by the National Bureau of Statistics for the first quarter, the first half and the first three quarters of the year, as well as for the full year. The effect of the adjustments is less than 0.4% for total annual emissions, with unadjusted numbers showing smaller in emissions in the third quarter.
CO2 emissions estimates are based on National Bureau of Statistics default calorific values of fuels and emissions factors from China’s latest national greenhouse gas emissions inventory, for the year 2018. Cement CO2 emissions factor is based on annual estimates up to 2023.
For oil consumption, apparent consumption is calculated from refinery throughput, with net exports of oil products subtracted.
Qi Qin, China analyst at CREA, contributed research


