Analysis: No growth for China’s emissions in Q3 2024 despite coal-power rebound
Lauri Myllyvirta
10.29.24Lauri Myllyvirta
29.10.2024 | 12:01amChina’s carbon dioxide (CO2) emissions stayed at, or just below, last year’s levels in the third quarter of 2024, after a fall in the second quarter.
The new analysis for Carbon Brief, based on official figures and commercial data, leaves open the possibility that China’s emissions could fall this year.
However, recent record-high temperatures caused emissions to go up in September and new government stimulus measures mean there is now greater uncertainty over the country’s emissions trajectory.
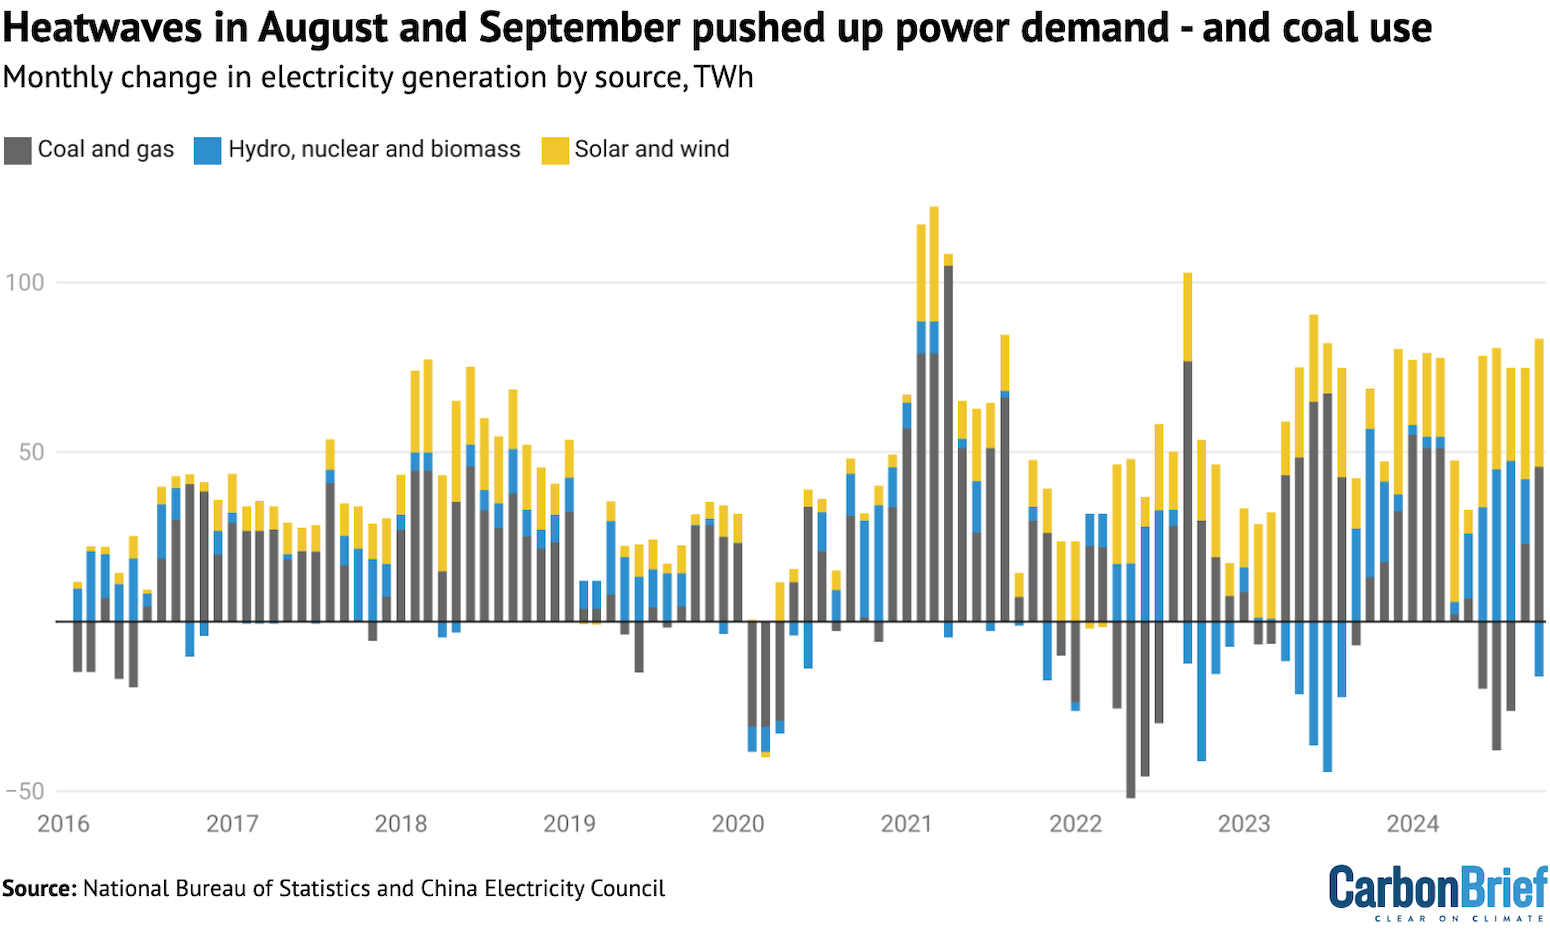
Heatwaves through much of August and September caused a major increase in electricity demand for air conditioning, which, combined with weak hydropower output, meant a 2% increase in coal-fired power generation and a 13% rise for gas-fired power in the third quarter, despite wind and solar growth continuing to break records.
The increase in emissions in the power sector was offset by falling emissions from steel, cement and oil use, plus stagnating gas demand outside the power sector, meaning China’s CO2 output in the third quarter was flat or slightly declined, relative to a year earlier.
Other key findings from the analysis include:
- Solar generation rose 44% in the third quarter of the year and wind by 24%, with both continuing to see record-breaking additions of new capacity.
- Hydro generation was up 11% compared with last year’s drought-affected figures, but remained short of expected output. Nuclear power was up 4%.
- Oil demand fell by around 2%, due to falling construction activity, the rise of electric vehicles (EVs) and natural gas (LNG) trucks, as well as weak consumer spending.
- Emissions from steel fell by 3% and cement by 12% in the third quarter, as both sectors continued to see the effect of falling construction activity.
- The coal-to-chemicals industry received renewed political backing and coal consumption in the sector has risen by nearly a fifth in the year to date.
Emissions would need to fall by at least 2% in the last three months of the year, for China’s annual total to drop from 2023 levels. This outcome is supported by the ongoing slowdown in industrial power demand growth and the end of the air-conditioning season.
However, new economic stimulus plans announced in late September with no apparent emphasis on emissions, add uncertainty to this outlook.
In any case, China will remain off track against its 2025 “carbon intensity” target, which requires emissions cuts of at least 2% in 2024 and 2025, after rapid rises in 2020-23.
Looking further ahead, policymakers recently provided new indications of the country’s plans for peaking and reducing emissions, signalling a gradual and cautious approach which falls short of what would be needed to align with the goals of the Paris Agreement.
But, if the country’s rapid clean energy growth is sustained, it has the potential to deliver emission reductions more swiftly.
Clean-energy expansion met all power-demand growth over summer
Defying predictions of slowing growth, China’s electricity demand increased by 7.2% year-on-year in the third quarter of 2024, up from an already rapid 6.9% in the second quarter.
The make-up of growth changed, however. Some 60% of the increase in demand came from the residential and services sectors, with household demand up by a blistering 15%.
Industrial power-demand growth continued to slow down, increasing by 4.6% in July–September, down from 5.9% in the second quarter.
At the same time, solar power generation increased by 44% year-on-year and wind power generation by 24%. Hydropower grew 11%, despite falling short of average utilisation, and nuclear power generation growth was muted at 4% due to few new reactors being commissioned.
The rapid rise of electricity demand outpaced these increases from low-carbon sources, with the gap between demand and rising clean supply being met by a 2% increase in coal-fired power generation and a 13% rise for gas-fired power, as shown in the figure below.
This caused a 3% increase in CO2 emissions from the sector in the third quarter of the year.
However, looking at the whole summer period, whether taken as May-September or June-August, clean-energy expansion covered all of electricity demand growth.
This year, August and September were hotter than last year, resulting in rapid growth in power demand for air conditioning. Last year, in contrast, June and July were hotter.
Thermal power generation from coal and gas fell overall during the summer period, despite the rapid increase in residential power demand, with a 7% drop in June, 5% drop in July, a 4% increase in August and a 9% increase in September. Growth rates during individual months are heavily affected by which months the worst heatwaves fall on.
In terms of newly built generating capacity, solar continued to break last year’s records, with 163 gigawatts (GW) added in the first nine months of 2024. This is equal to the combined total capacity in Germany, Spain, Italy and France, the four EU countries with the most solar capacity. China’s solar capacity additions in the third quarter were up 22% year-on-year, as shown in the figure below.
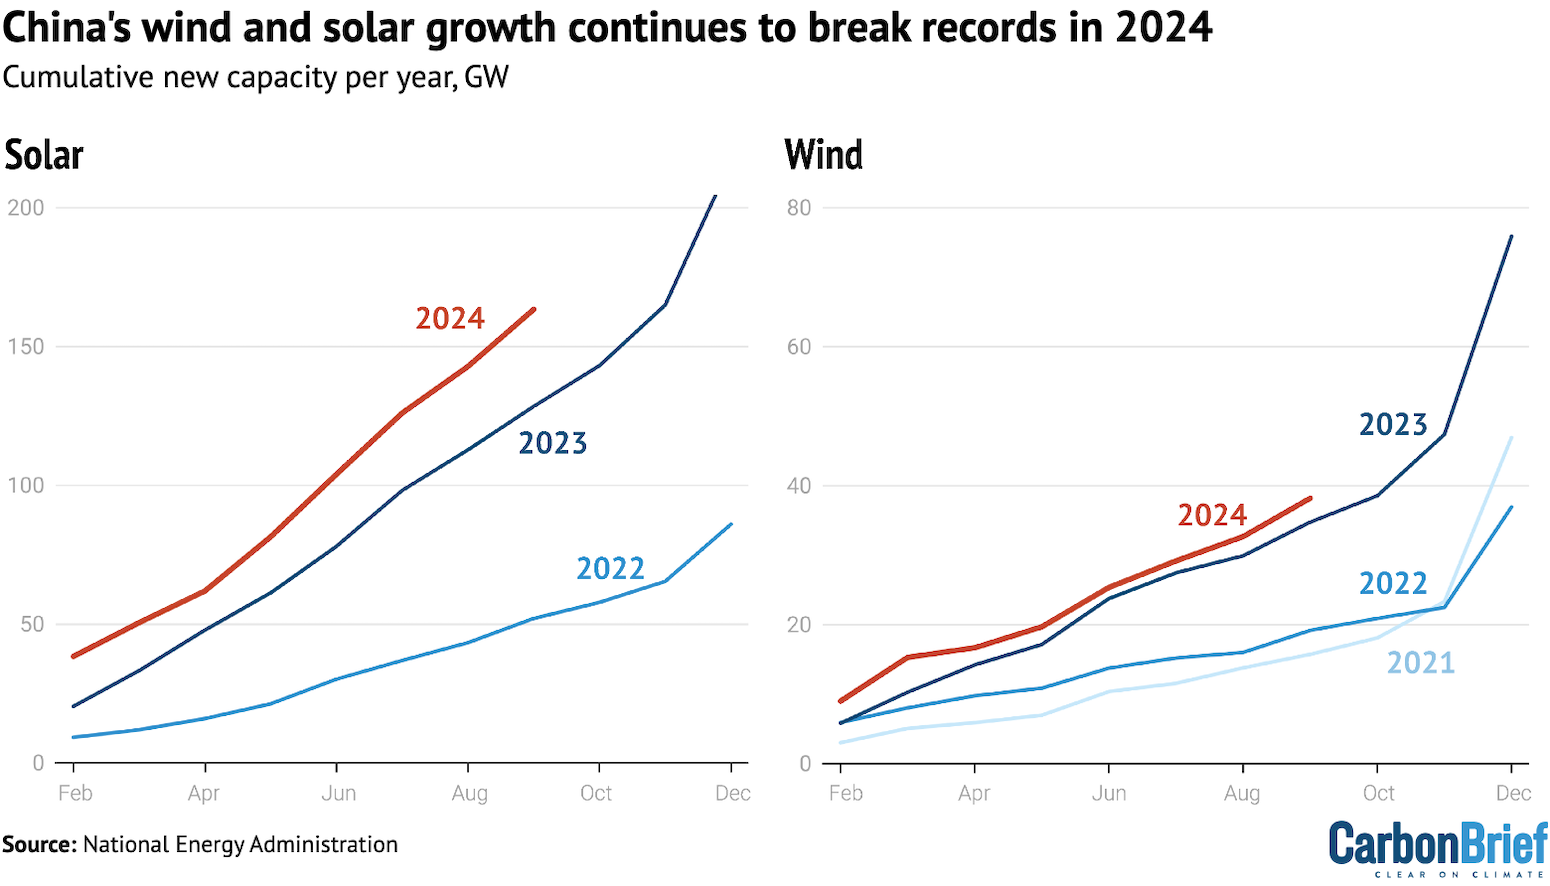
The growth in China’s solar power output this year alone is likely to equal the total power generation of Australia or Vietnam in 2023, based on growth rates during the first nine months of the year.
Wind power additions accelerated as well, with 38GW added in the year to September, up 10% year-on-year and exceeding the total wind power capacity in the UK of 30GW.
China’s State Council approved 11 new nuclear reactors for construction in one go in August. The total power generating capacity of the approved projects is about 13GW. With 10 reactors approved in both 2022 and 2023 – and now 11 in 2024 – the next batch of nuclear power capacity is getting off the ground and adding to China’s clean-energy growth.
Hydropower capacity only increased 2% year-on-year, implying that most of the 11% third-quarter increase in generation was due to a recovery in capacity utilisation.
In response to severe droughts, utilisation had fallen to its lowest level in more than a decade in 2022, and recovered only partially in 2023, so this year’s recovery was expected and is closer to expected average hydropower generation.
China’s approvals of new coal power plant projects plummeted by 80% in the first half of 2024. Just 9GW of new capacity was approved, down from 52GW in the first half of last year. However, according to the Polaris Network, an energy sector news and data provider, eight large coal power projects were approved in the third quarter, likely representing an uptick in the rate of approvals compared with the first half of the year.
Construction and oil demand slowdown continued to pull down total emissions
While power sector emissions saw a small amount of growth in the third quarter of 2024, the ongoing contraction in construction volumes pulled down total emissions.
As a result, CO2 emissions stayed flat in the third quarter of 2024, at or just below the levels seen in the same period a year earlier, as shown in the figure below.
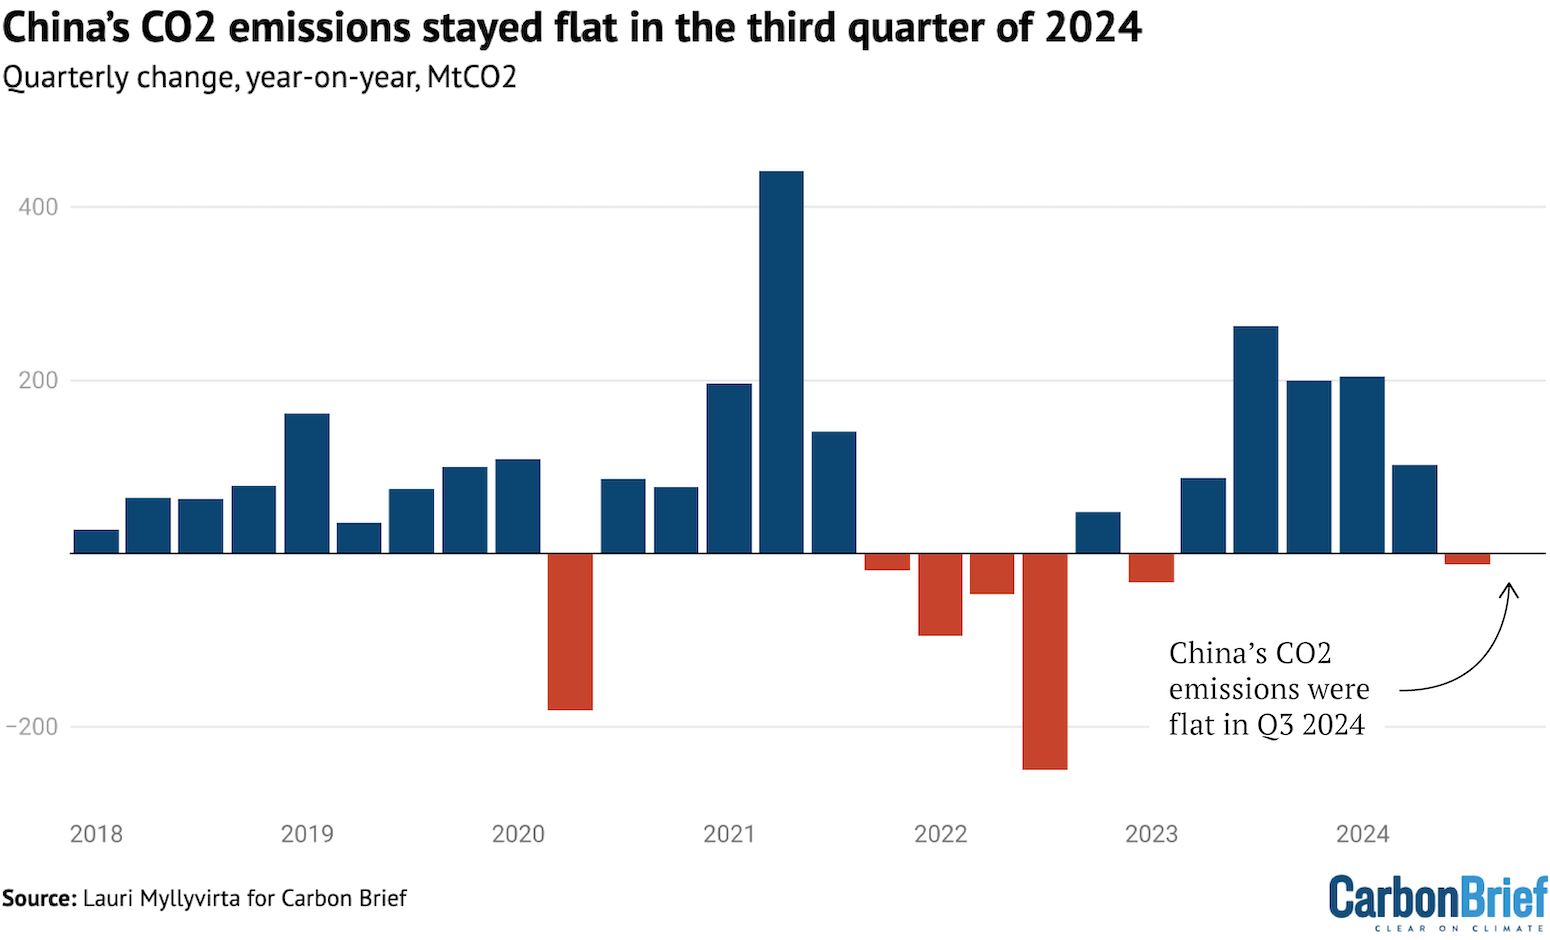
Digging deeper into the construction-led decline in emissions outside the power sector, steel output fell 9% and cement 12%, as real estate investment contracted 10% in the third quarter, maintaining the same rate as in the first half-year.
This translated into an 11% (24m tonnes of CO2, MtCO2) reduction in CO2 emissions from cement compared with the same period in 2023, shown in the figure below.
Steel emissions only fell by 3% (13MtCO2), despite the 9% fall in steel production. The reason is that the brunt of the drop in demand was borne by electric arc steelmakers rather than the coal-based steel plants with a much higher emission intensity.
The sector lacks the incentive to prioritise electric arc furnaces, which use recycled scrap and have much lower emissions. In theory, this could be encouraged by the inclusion of steel in China’s emissions trading system.
However, if the sector is treated in the same way as power, with separate benchmarks for coal-based and electric steelmaking, it will not create incentives to switch to electricity.
As one step towards structural change in the sector, the industry ministry issued a policy suspending all permitting of new steelmaking capacity, turning a de-facto stop to new permits – observed since the beginning of the year – into a formal moratorium. Until last year, the sector had been investing heavily in new coal-based steel capacity.
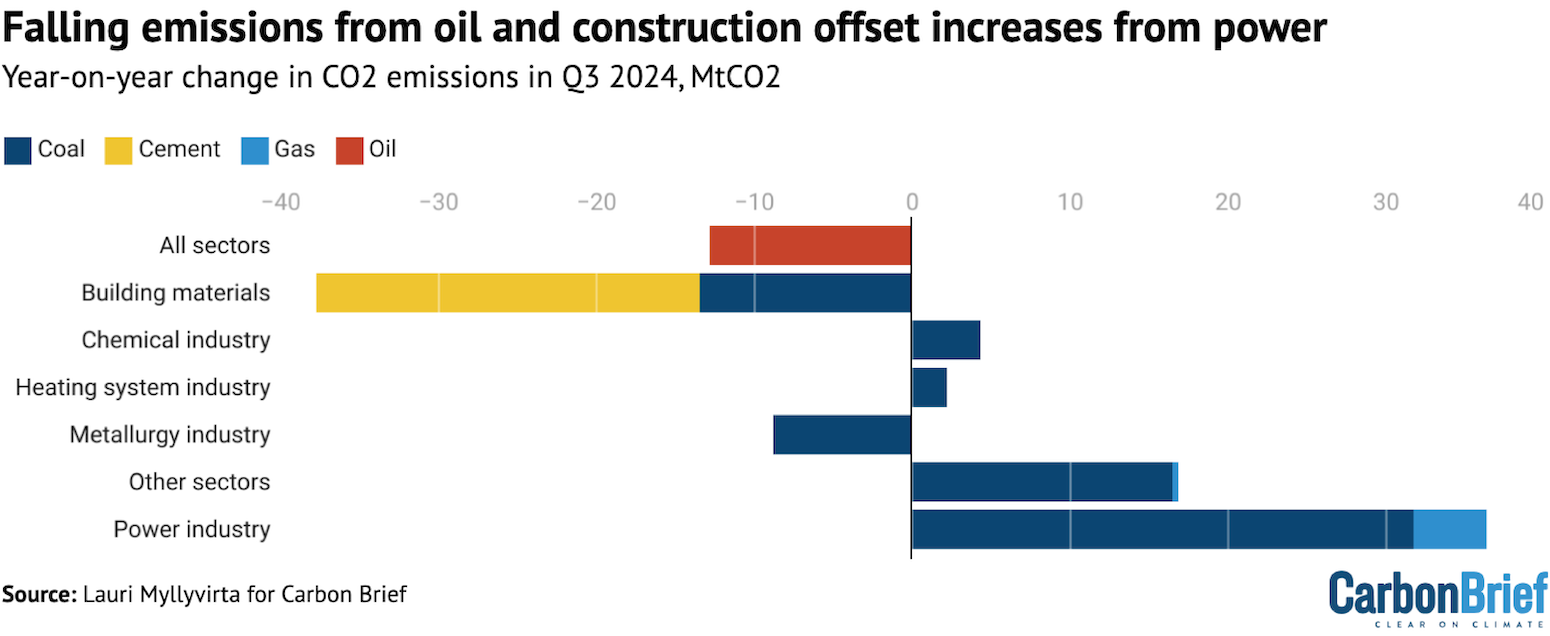
The other major area where emissions fell is oil consumption, which saw a 2% (13MtCO2) reduction in oil-related CO2 emissions in the third quarter of the year, also shown in the figure above. This is based on numbers from the National Bureau of Statistics.
The reduction in oil demand and related CO2 emissions may have been even steeper. The supply of oil products, measured as refinery throughput net of imports and exports, fell much more sharply. Based on this measure, CO2 from burning oil fell 10% (63MtCO2) in the third quarter, meaning that China’s CO2 emissions overall would have fallen by 2%.
The much more modest drop reported by the statistics agency could reflect the tendency of China’s statistical reporting to smooth downturns and upticks.
Another possible explanation is that refineries had previously been producing more than was being consumed, and have now had to cut output to reduce inventories.
Regardless of the magnitude of the drop, it is possible to identify the drivers of falling oil consumption. The fall in construction volumes is a major factor, as a significant share of diesel is used at construction sites and for transporting building materials.
The increase in the share of EVs is eating into petrol demand. Demand was also driven down by household spending, which remained weak until picking up in October in response to expectations of government stimulus.
The increasing share of trucks running on LNG also contributed to the fall in diesel demand. LNG truck sales accounted for about 20% of total truck sales in the nine months to March 2024, but weak overall gas demand growth indicates that this had a limited impact.
Gas consumption growth slowed down to 3% in the third quarter, from 10% in the first half of the year. Growth took place entirely in the power sector, with demand from other sectors stagnating, likely due to weak industrial demand.
After an increase in emissions in January-February, falling emissions in March-August and an increase in September, emissions would need to fall by at least 2% in the last three months of the year, for China’s annual total to drop from 2023 levels.
There is a good chance this will happen, due to an ongoing slowdown in industrial power demand growth and the end of the air conditioning season. But, even then, China would remain off track against its 2025 carbon intensity target, which requires emissions to fall by at least 2% in both 2024 and 2025, after rapid increases from 2020 to 2023.
The fundamental reason why emissions have not fallen faster – and may not have fallen at all in the third quarter – is that energy consumption growth this year continues to be much faster than historical trends.
Total energy consumption – including, but not limited to electricity consumption – grew 5.0% in the third quarter, faster than GDP, which gained 4.6%.
Until the Covid-19 pandemic, China’s energy demand growth had been much slower than GDP growth, implying falling energy intensity of the economy.
The post-Covid economic policy focused on manufacturing appears to have reversed this trend.
Coal-to-chemicals industry received new political backing
One additional wildcard in the outlook for China’s CO2 emissions is the coal-to-chemicals industry. The sector turns domestic coal into replacements for imported oil and gas, albeit with a far higher carbon footprint.
A recent policy from the National Development and Reform Commission, China’s powerful planning agency, called for ”accelerating” the development of the coal-to-chemical industry, including “speeding up the construction of strategic bases for coal-to-oil and coal-to-gas production”.
The past weeks after the issuance of the new policy have seen construction starts of a major coal-to-oil project in Shanxi, a coal-to-chemicals park in Sha’anxi and approval of a similar project in Xinjiang.
The coal-to-chemicals industry is expected to use more than 7% of all coal consumed in China in 2024, according to China Futures Research, a consultancy.
Coal consumption by the chemicals industry increased 18% in the first eight months of 2024, after a 9% increase in 2023, based on data from Wind Financial Terminal. This increase in coal consumption for coal-to-chemicals contributed two thirds of the 0.9% increase in total fossil CO2 emissions during the January to August period.
Coal consumption growth in the sector slowed down to 5% in July-August, however, and output of chemical products continued to slow in September. This smaller contribution to growth in CO2 emissions is shown in the graph above (“chemical industry”).
The recent rise in oil and gas prices, together with efforts to increase China’s domestic coal production and drive down domestic coal prices, have provided a major boost to the coal chemicals sector, which has a high sensitivity to both oil and coal prices.
Coal-to-chemicals is the sector where China’s policy priorities of energy security and emission reductions are most directly at odds.
Economic stimulus adds uncertainty to emissions outlook
After economic data indicated continuing slowdown and shortfall against GDP growth targets over the summer, expectations of a stimulus package built up.
The government responded in late September with a set of announcements, pledging various stimulus measures. The measures were focused on financial markets, but also included a commitment to “stabilise” the housing market.
The size of the stimulus package is not very large by China’s standards, and further details have disappointed those who hoped for a more radical policy turnaround. Yet, the package is clearly thought-through and coordinated, offering insights into how China’s top policymakers are planning to address the economic headwinds.
Direct income transfers of government money to households, which have been a hot topic for the past couple of years, are now going to be tried out.
Efforts to boost household spending, instead of the energy-intensive manufacturing and construction that has been the focus of previous rounds of government stimulus, would enable China to grow in a much less energy- and carbon-intensive way.
However, the sums allocated to income transfers are very small in relation to the size of the whole package. Much more money will be spent on subsidies to car and white-goods purchases. This will free up household cash for other types of spending, but it also directs household spending in the most energy-intensive direction.
Most of the stimulus is directed through the traditional routes of local government borrowing and bank lending, which tend to go into industrial and infrastructure projects.
There is no explicit climate-related emphasis to this stimulus. Quite a bit of it is likely to flow to clean energy-related investments, simply because those have been so dominant in China’s investment flows recently, but there is no further push in that direction.
Policymakers do not see an ‘early’ peak
While the rapid clean-energy growth points to the possibility of China’s emissions peaking imminently, policymakers are still setting an expectation that emissions will increase until the end of the decade and plateau or fall very gradually thereafter.
In August, China’s National Energy Administration played down the possibility of the country’s emissions having already peaked, in response to a question from a reporter referencing analyses suggesting this was possible.
The NEA department head who responded to the question emphasised that the timeline for peaking the country’s emissions – “before 2030” – has already been set by the top leadership, implying that the NEA has no mandate to change it.
The Central Committee of the Communist Party – one of the country’s highest leadership groups – reaffirmed that the aim is to “establish a falling trend” in emissions by 2035.
An earlier State Council plan said that China would focus on controlling total CO2 emissions, rather than emissions intensity, after the emission peak has been reached, and indicated that this would not happen in the 2026-30 period.
A very gradual approach to peaking emissions and reducing them after the peak, leaving more substantial emission reductions to later decades, is permissible under China’s current commitments under the Paris Agreement.
However, such a pathway would see the country use up 90% of the global emission budget for 1.5C. In scenarios that limit warming to 1.5C, China’s emissions are cut to at least 30% below 2023 levels by 2035. And recent International Energy Agency (IEA) analysis found that emerging markets such as China would need to cut emissions to 35-65% below 2022 levels by 2035, to align with the global pledges made at COP28 or national net-zero targets.
In contrast with the cautious approach telegraphed by Chinese policymakers, maintaining the rate of clean energy additions and electrification achieved in recent years could deliver a 30% reduction in CO2 emissions from fossil fuels by 2035, relative to 2023 levels.
Similarly, the IEA’s latest World Energy Outlook found clean-energy growth would help cut China’s CO2 emissions to 24% below 2023 levels by 2035, based on current policy settings. This reduction would increase to 45% by 2035 if China met its announced ambitions and targets, the IEA said.
China’s upcoming nationally determined contribution (NDC), due to be submitted to the UN under the Paris Agreement by February 2025, is expected to provide more clarity on which emissions pathway the policymakers are pursuing.
About the data
Data for the analysis was compiled from the National Bureau of Statistics of China, National Energy Administration of China, China Electricity Council and China Customs official data releases, and from WIND Information, an industry data provider.
Wind and solar output, and thermal power breakdown by fuel, was calculated by multiplying power generating capacity at the end of each month by monthly utilisation, using data reported by China Electricity Council through Wind Financial Terminal.
Total generation from thermal power and generation from hydropower and nuclear power was taken from National Bureau of Statistics monthly releases.
Monthly utilisation data was not available for biomass, so the annual average of 52% for 2023 was applied. Power sector coal consumption was estimated based on power generation from coal and the average heat rate of coal-fired power plants during each month, to avoid the issue with official coal consumption numbers affecting recent data.
When data was available from multiple sources, different sources were cross-referenced and official sources used when possible, adjusting total consumption to match the consumption growth and changes in the energy mix reported by the National Bureau of Statistics for the first quarter, the first half and the first three quarters of the year. The effect of the adjustments is less than 1% for total emissions, with unadjusted numbers showing a 1% reduction in emissions in the third quarter.
CO2 emissions estimates are based on National Bureau of Statistics default calorific values of fuels and emissions factors from China’s latest national greenhouse gas emissions inventory, for the year 2018. Cement CO2 emissions factor is based on annual estimates up to 2023.
For oil consumption, apparent consumption is calculated from refinery throughput, with net exports of oil products subtracted.
Chengcheng Qiu, China analyst at Centre for Research on Energy and Clean Air, contributed research.
-
Analysis: No growth for China’s emissions in Q3 2024 despite coal-power rebound


