Analysis: Clean energy contributed a record 10% of China’s GDP in 2024
Multiple Authors
02.19.25Multiple Authors
19.02.2025 | 12:01amClean-energy technologies made up more than 10% of China’s economy in 2024 for the first time ever, with sales and investments worth 13.6tn yuan ($1.9tn).
Clean-energy sectors drove a quarter of the country’s gross domestic product (GDP) growth in 2024 and have overtaken real-estate sales in value.
The new sector-by-sector analysis for Carbon Brief, based on official figures, industry data and analyst reports, shows the growing role of clean technology in China’s economy – particularly the so-called “new three” industries, namely, solar, electric vehicles (EVs) and batteries.
For this analysis, a broad definition has been used for “clean-energy” sectors, including renewables, nuclear power, electricity grids, energy storage, EVs and railways. These are technologies and infrastructure needed to decarbonise China’s production and use of energy.
Other key findings from the analysis include:
- Clean-energy investment reached 6.8tn yuan ($940bn), with annual growth of 7% cooling markedly – as expected – from the 40% expansion in 2023.
- China’s investment in clean energy was close to the global total put into fossil fuels in 2024 and was of a similar scale to the overall size of Saudi Arabia’s economy.
- The “new three” of EVs, batteries and solar continued to dominate the economic contribution of clean energy in China, generating three-quarters of the value added and, overall, attracting more than half of all investment in the sectors.
- The growth in economic output from clean-energy sectors played a key role in driving their overall contribution to GDP in 2024, whereas investment was the driver in 2023.
- Including the value of production, clean-energy sectors contributed 13.6tn yuan ($1.9tn) to China’s economy overall – just above 10% of total GDP.
- These sectors grew three times as fast as the Chinese economy overall, accounting for 26% of all GDP growth in 2024.
- Significantly, China would have missed its 5% target for GDP growth without the growth from clean technologies, expanding by 3.6% instead of the 5.0% reported.
There is likely to be further growth in clean-energy investment in 2025 as major projects race to finish before the end of the 14th five-year plan, covering 2021-2025.
Beyond this year, development of the clean-energy sectors depends strongly on the new targets and policies in the next five-year plan, which is being finalised this year.
- Clean energy reaches GDP milestone
- EVs and solar were the top growth drivers
- Role of cleantech manufacturing in emissions growth
- Falling prices boost adoption, but challenge producers
- Implications of rapidly growing clean-energy economy
- About the data
Clean energy reaches GDP milestone
In 2023, clean energy was behind an estimated 40% of economic growth in China, driven by a huge wave of investment in manufacturing capacity in the sector.
As noted in last year’s analysis, it was inevitable that the extraordinary growth rates of investment would cool down in 2024 – and the new data bears this out.
Nevertheless, investment in the clean-energy sectors continued to grow in 2024. Moreover, growth in the production of goods and services in the sectors held up, at over 20%.
As a result, clean-energy sectors made up more than 10% of China’s GDP in 2024 for the first time ever, as shown in the figure below.

The overall economic contribution from clean-energy sectors, at 13.6tn yuan ($1.9tn), is of a similar scale to many major economies, such as Australia or Mexico.
Equally, the sectors now make up a larger share of China’s economy than real-estate sales, at 9.6tn yuan, or agriculture at 9.1tn yuan.
EVs and solar were the top growth drivers
The value of production and investments in clean-energy sectors grew an estimated 13% overall in 2024 – and has increased by 50% since 2022, as shown in the figure below.

Investments in clean-energy sectors reached an estimated 6.8tn yuan ($940bn), up 7% year-on-year, contributing almost half of all growth in fixed asset investments.
The production of goods and services in the sectors grew by 21%, reaching 6.8tn yuan ($950bn).
Electric-vehicle production was the most valuable sector overall, followed by clean-power production, rail transportation, electricity transmission and storage and energy efficiency.
The table below includes a detailed breakdown by sector and activity.
| Sector | Activity | Value in 2024, CNY bln | Value in 2024, USD bln | Year-on-year growth |
|---|---|---|---|---|
| EVs | Investment: manufacturing capacity | 1,393 | 194 | 11% |
| EVs | Investment: charging infrastructure | 122 | 17 | 20% |
| EVs | Production of vehicles | 3,067 | 427 | 36% |
| Batteries | Investment: battery manufacturing | 205 | 29 | -35% |
| Batteries | Exports: batteries | 494 | 69 | 8% |
| Solar power | Investment: power generation capacity | 1,031 | 144 | 28% |
| Solar power | Investment: manufacturing capacity | 779 | 109 | -18% |
| Solar power | Electricity generation | 386 | 54 | 41% |
| Solar power | Exports of components | 607 | 85 | 14% |
| Wind power | Investment: power generation capacity, onshore | 417 | 58 | 5% |
| Wind power | Investment: power generation capacity, offshore | 48 | 7 | -44% |
| Wind power | Electricity generation | 440 | 51 | 14% |
| Nuclear power | Investment: power generation capacity | 129 | 18 | 49% |
| Nuclear power | Electricity generation | 200 | 28 | 3% |
| Hydropower | Investment: power generation capacity | 95 | 13 | 19% |
| Hydropower | Electricity generation | 567 | 79 | 11% |
| Rail transportation | Investment | 851 | 118 | 11% |
| Rail transportation | Transport of passengers and goods | 990 | 138 | 3% |
| Electricity transmission | Investment: transmission capacity | 608 | 85 | 15% |
| Electricity transmission | Transmission of clean power | 46 | 6 | 17% |
| Energy storage | Investment: Pumped hydro | 403 | 56 | 13% |
| Energy storage | Investment: Grid-connected batteries | 134 | 19 | 70% |
| Energy storage | Investment: Electrolysers | 9 | 1 | 94% |
| Energy efficiency | Revenue: Energy service companies | 540 | 75 | 4% |
| Total | Investments | 6,765 | 942 | 7% |
| Total | Production of goods and services | 6,797 | 947 | 21% |
| Total | Total GDP contribution | 13,562 | 1889 | 13% |
Electric vehicles and batteries
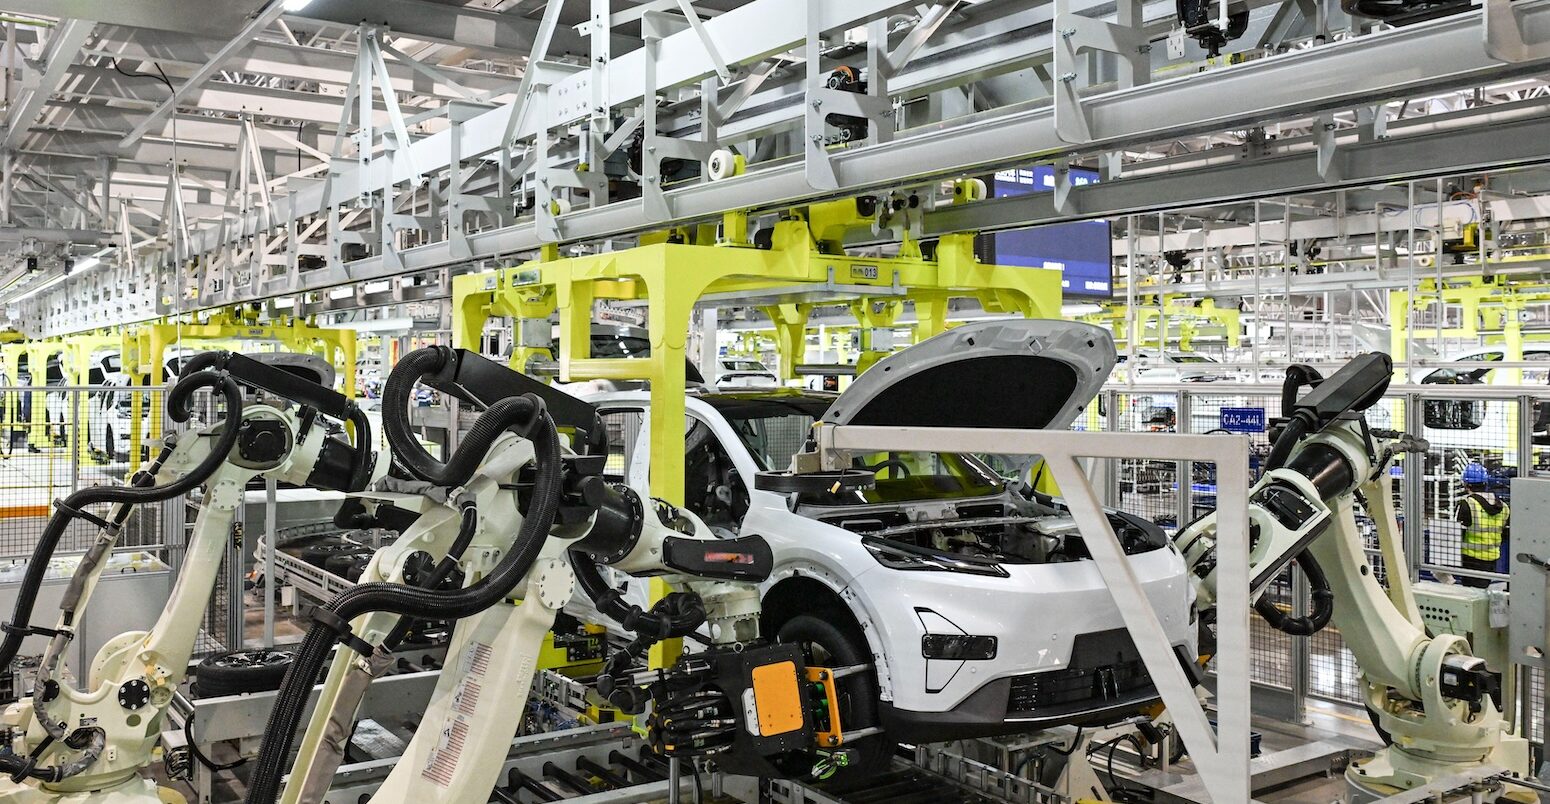
EVs and vehicle batteries were the largest contributors to China’s clean-energy economy in 2024, making up an estimated 39% of value overall.
Of this total, the largest share was from the production of battery EVs and plug-in hybrids – which together make up the bulk of what China calls “new energy vehicles” (NEVs) – worth more than 3tn yuan, followed by investment in NEV and battery manufacturing.
Investment in factories for making NEVs grew 11% to 1.4tn yuan, moderating from the high growth rates seen in 2023. The amount of money invested in new battery manufacturing facilities fell year-on-year, making a negative contribution to growth.
China produced 13m NEVs in 2024, rising 34% year-on-year. Some 22% of Chinese-made NEVs were exported, while the rest were sold domestically.
NEVs are the only growth sector for Chinese carmakers, as shown in the figure below. Moreover, NEVs made up 41% of total vehicle sales in 2024, up from 32% in 2023.
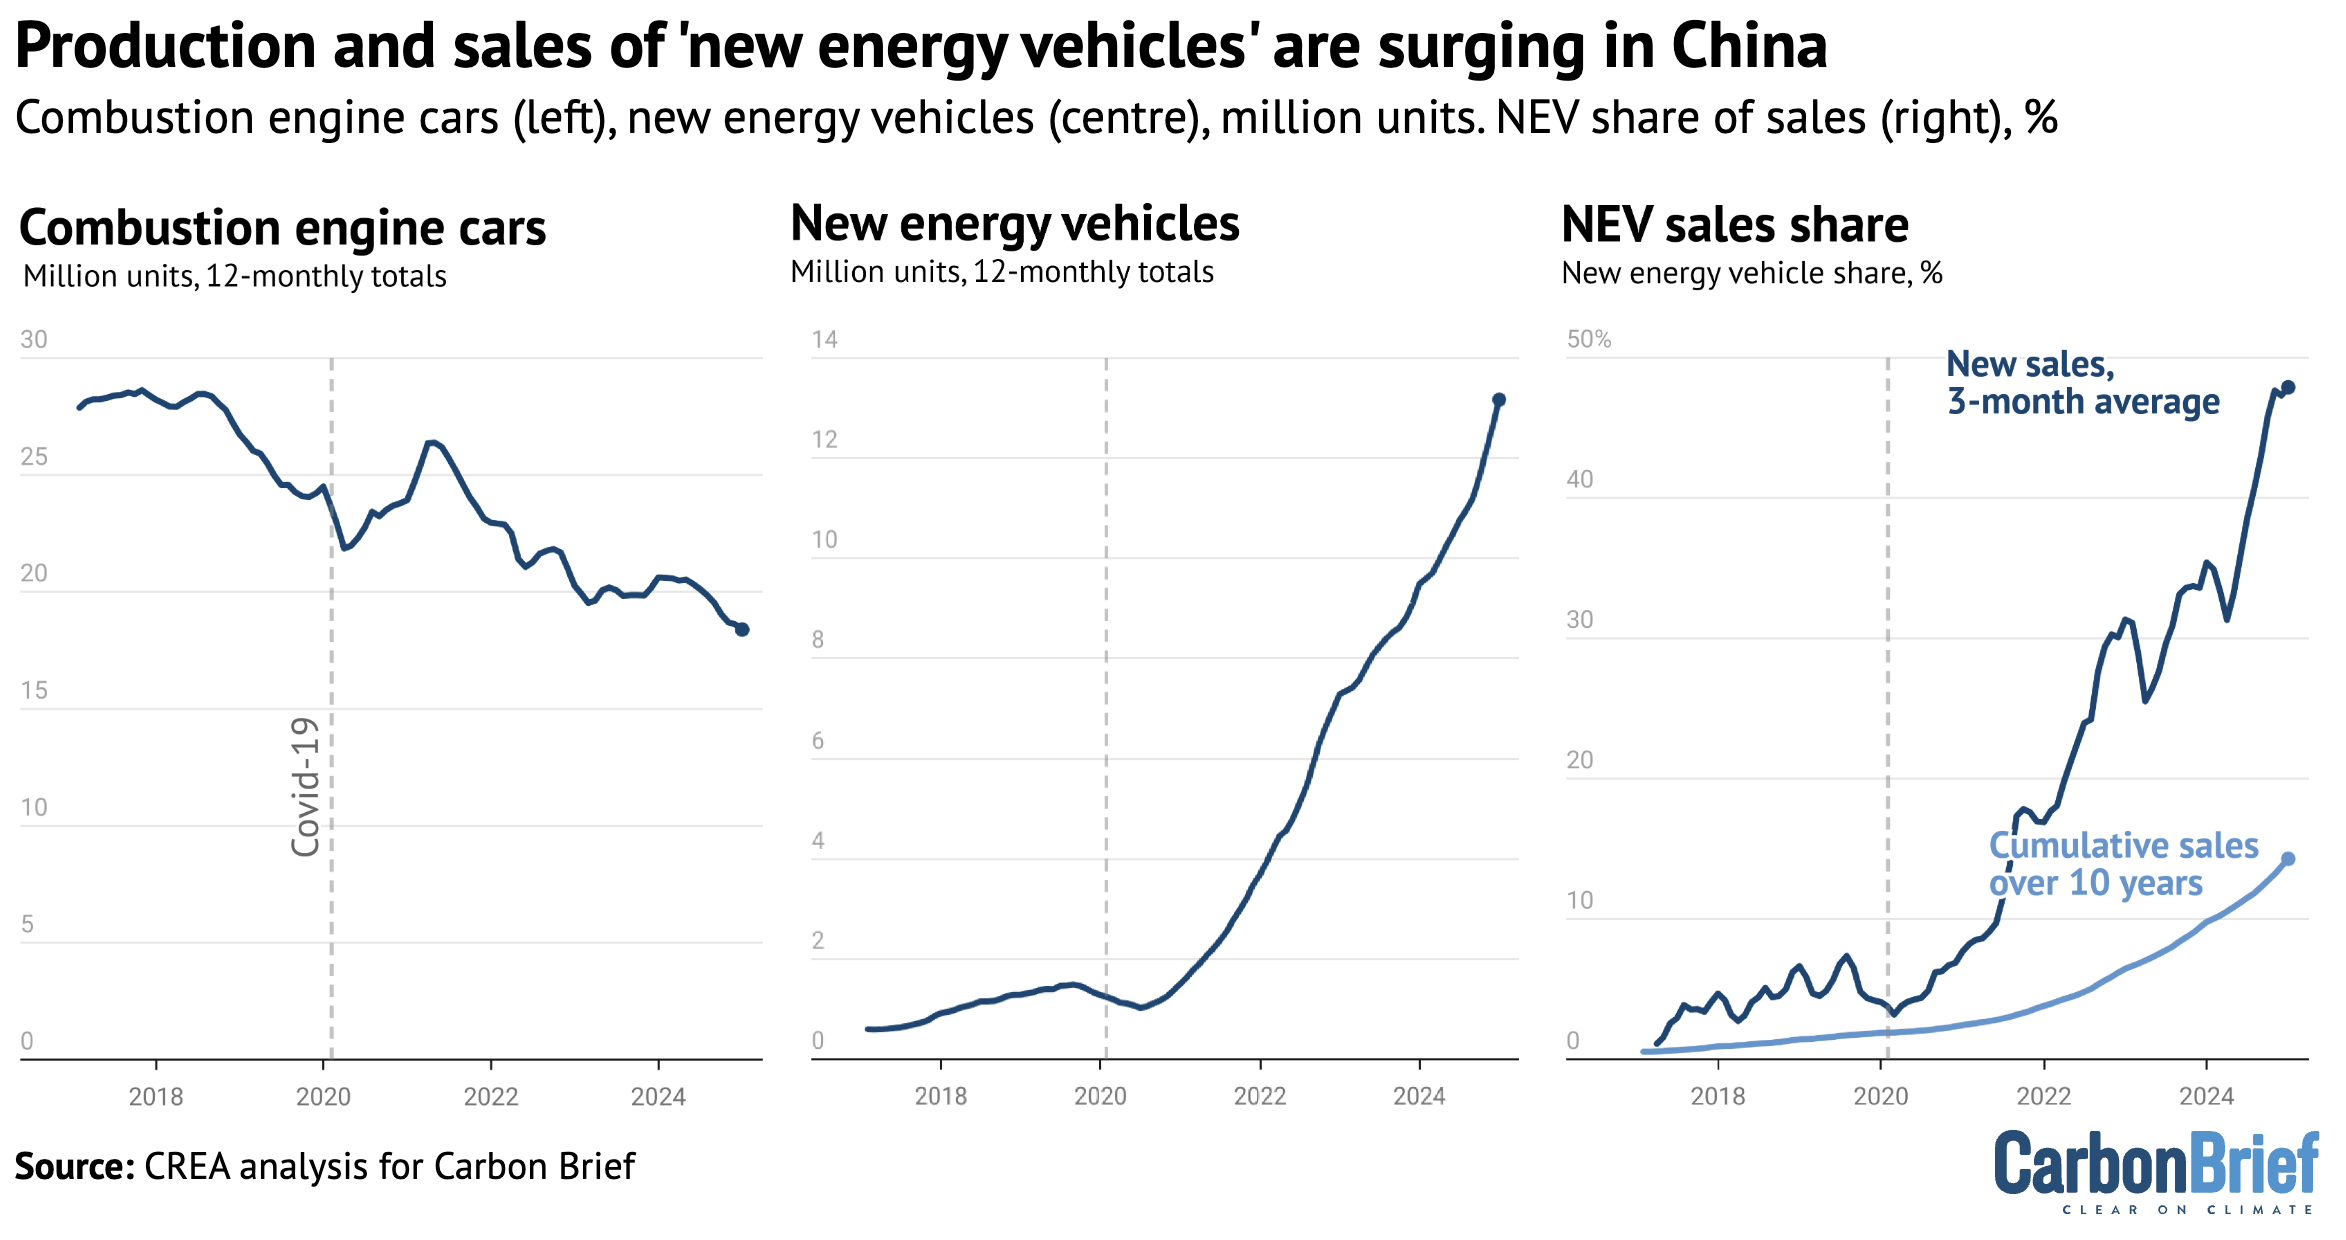
Domestic EV sales were supported by local government policies promoting vehicle replacement, but the strong sales also show that EVs have gained broad market acceptance.
New EV models have improved range and significantly shorter charging times – often under an hour – helping to ease consumer concerns. They also offer smart features such as “navigate on autopilot” self-driving, that provide a better driving experience.
Much of the growth in EV production is now in plug-in hybrid vehicles. The extent to which these cut emissions depends on their being driven mostly on electricity.
Real-world data suggests plug-in hybrids are rarely driven in electric mode in Europe. However, the electricity use of EV battery charging and swapping services in China rose by 51% in 2024, to levels consistent with a high level of electric driving from plug-in hybrids.
The growth in EV charging was supported by strong investment in charging infrastructure, with 4.2m charging points added in 2024, up 20% year-on-year. The total number of charging points reached 12.8m.
The average selling price of EVs in 2024 fell by just 8% year-on-year to 240,000 yuan ($33,000), despite intense competition in the sector.
While weaker than growth in domestic sales, EV exports still expanded 6.7% year-on-year, driven primarily by a 190% surge in the export of plug-in hybrids, while battery EV exports declined by 10.4%.
This trend may be linked to EU tariffs targeting battery EVs, but excluding hybrids.
The top growth markets were Brazil, Belgium, Mexico, the UAE and Indonesia, reflecting Chinese automakers’ efforts to expand in markets where they do not face high tariffs or to accelerate exports before tariff increases take effect.
Investment in overseas production capacity is also supporting growth. For example, BYD’s joint factory with BMW in Hungary is set to begin production in late 2025.
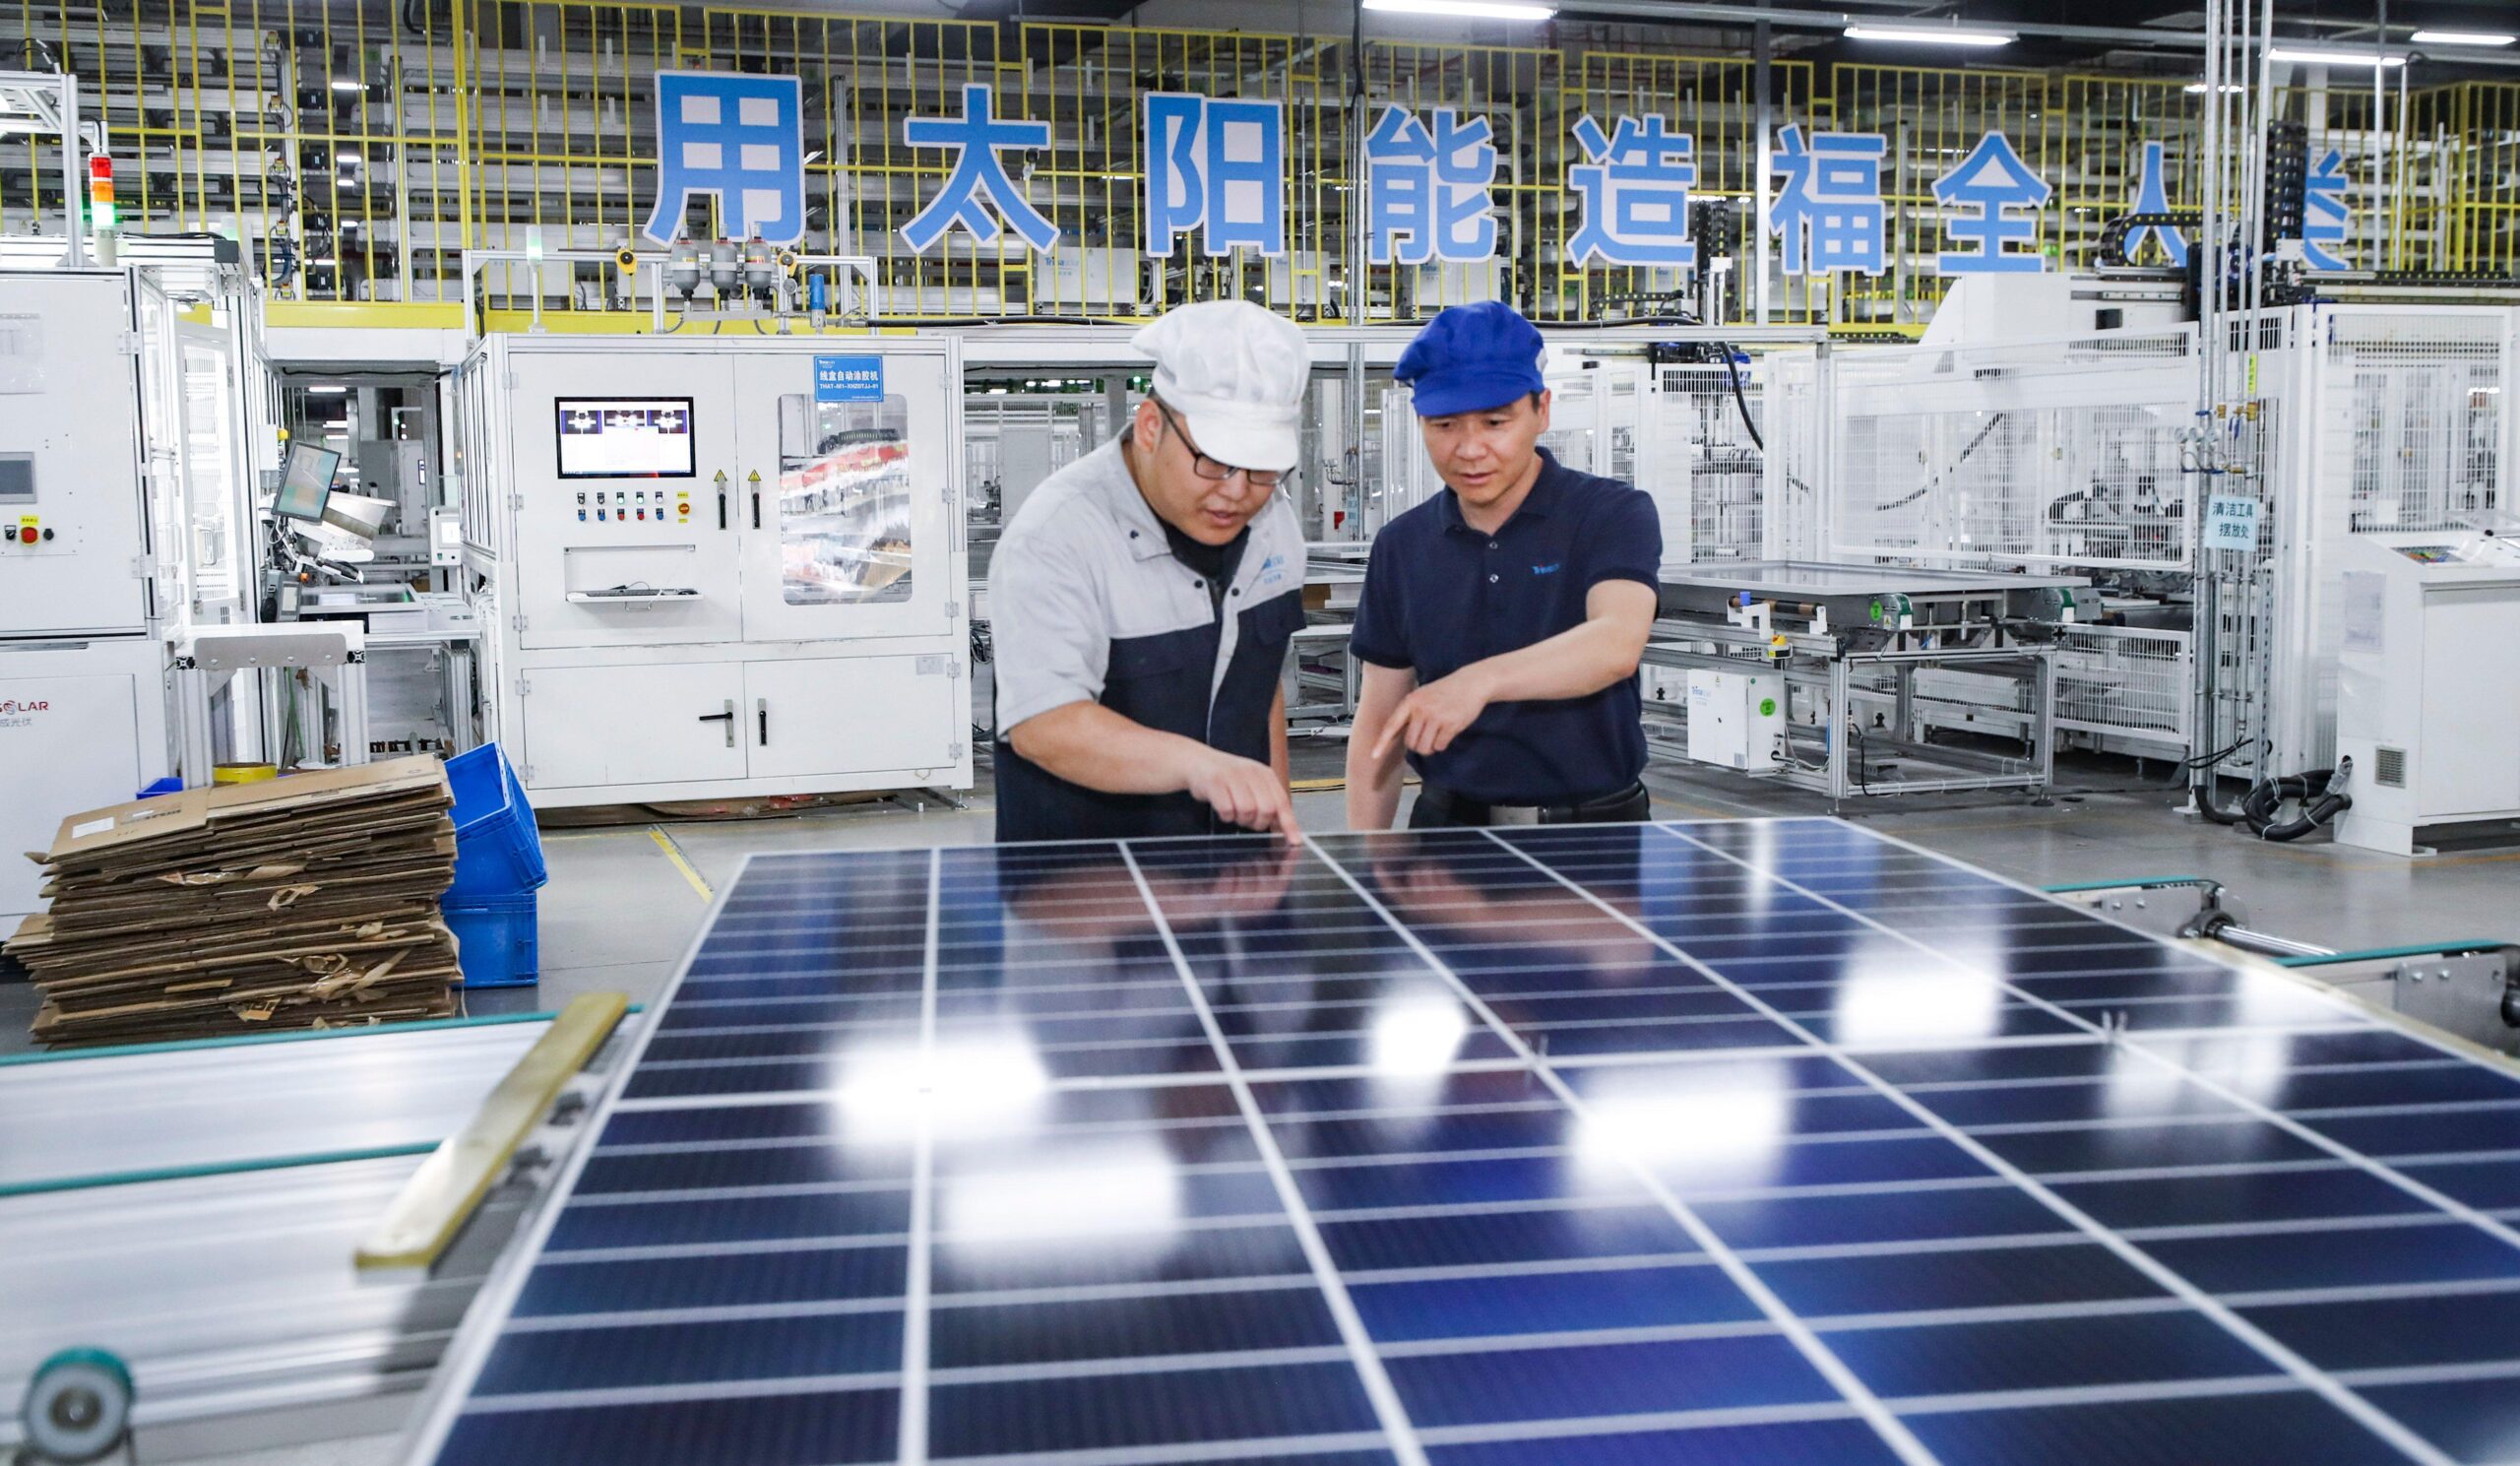
Solar
After EVs and batteries, the next-largest clean-tech contribution to China’s GDP in 2024 came from solar power, which completes the “new three” industries.
Solar generated 21% of the total value of the clean-energy industries in 2024, adding 2.8tn yuan ($390bn) to the national economy.
Within this, investment in power generation projects, at 1tn yuan ($140bn), overtook manufacturing investment (0.8tn yuan, $109bn) as the largest contributor to the value of the sector. The value of solar power technology exports (0.6tn yuan, $85bn) was the third-largest, followed by the value of the power generated from solar (0.4tn yuan, $54bn).
The figure below shows the surge of Chinese investments in new solar power capacity – which has grown 10-fold in just five years – alongside spending on new wind, hydro and nuclear capacity (see next section).

China added some 277 gigawatts (GW) of new solar capacity in 2024, up 28% year-on-year from the previous year’s 216GW, which was also a record. This increase included strong growth from both large-scale and distributed segments.
Centralised solar capacity grew the most in the western provinces of Xinjiang and Inner Mongolia, home to China’s gigantic “clean energy bases”. The relatively prosperous coastal provinces of Jiangsu, Zhejiang and Guangdong led the growth of distributed capacity.
As major manufacturing hubs, these coastal provinces have a large potential for distributed solar at industrial sites, where most of the power can be consumed locally.
Rising commercial electricity prices, along with pressure to meet energy-saving and carbon reduction targets, are further driving investment in industrial and commercial distributed solar.
Expansion of distributed solar in some other provinces is being limited by grid constraints. Henan, which topped the list of increases in distributed solar capacity in 2023, saw a slowdown in capacity additions, as residential solar-power producers have faced restrictions on selling power to the grid.
Solar manufacturing capacity additions slowed down sharply in 2024, reflecting falling product prices and a supply glut. Still, manufacturing capacity at the end of 2024 rose by 29% compared with a year earlier.
The production of solar cells only increased by 16%, showing that manufacturing capacity additions are running ahead of demand and leading to weakened capacity utilisation at solar production lines.
As a result, investments in solar manufacturing capacity are likely to slow down even further in the coming years.
Other clean power generation
Hydropower, wind and nuclear were responsible for 14% of the total value of the clean-energy sectors in 2024, adding some 1.9tn yuan ($264bn) to China’s GDP in 2024.
Nearly two-thirds of this (1.2tn yuan, $168bn) came from the value of power generation from hydropower, wind and nuclear, with investment in new power generation projects – shown in the chart above – contributing the rest.
Power generation grew 14% from wind, 11% from hydropower and 3% from nuclear. The rise in hydropower generation was mainly due to improved operating conditions as installed capacity only grew 1.2%.
Within investment, wind-power generation projects were the largest contributor to value, representing some 465bn yuan ($65bn) of spending in 2025. However, investment in nuclear projects, which increased by nearly half year-on-year, made the largest contribution to clean-energy spending growth. Investment in conventional hydropower declined slightly.
Wind-power investment was dragged down by a large drop in the commissioning of offshore wind capacity, which fell 44% year-on-year to just 4GW in 2024. This is expected to rebound strongly next year to 14-17GW.
Newly added onshore wind power capacity increased 5% year-on-year, reaching 76GW, on top of the blistering 85% increase in 2023.
Nuclear saw strong growth, with 3.9GW completed in 2024, up from 1.4GW a year earlier. As a result of record approvals of new projects in 2022-2024, China now has more than 50 GW of new nuclear generation capacity permitted or under construction, implying a major uptick in capacity additions in the next five years, the typical construction timeline for new projects in China.
There is likely to be further strong growth in clean power investments in 2025, as large schemes race to complete before the end of the five-year plan period at the end of the year.
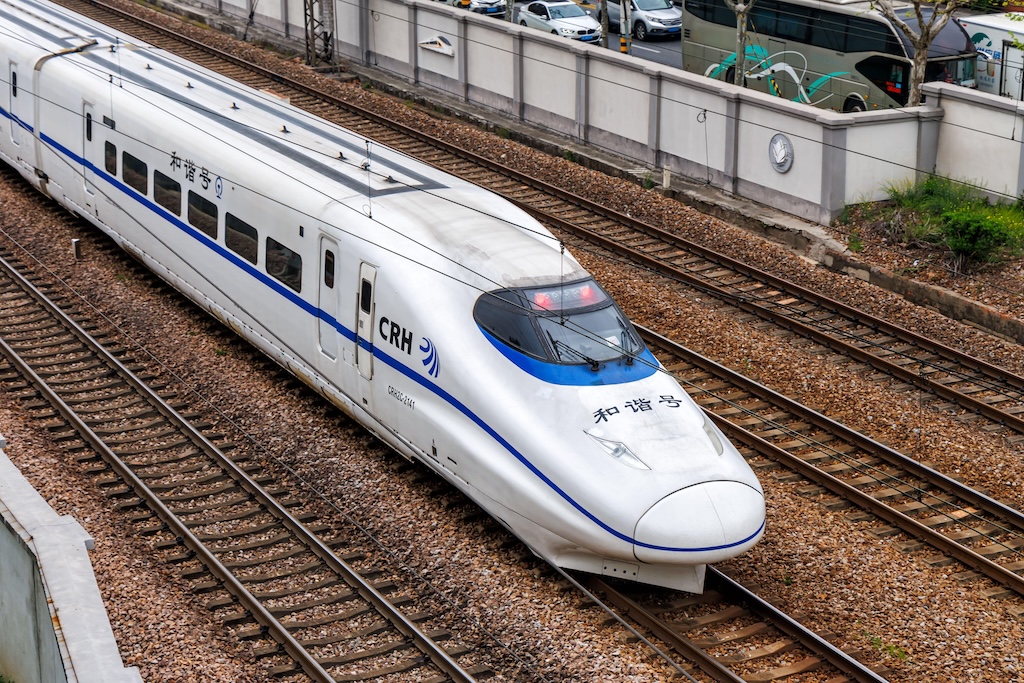
Railways
Rail transportation made up 14% of the value of the clean-energy sectors, with revenue from passenger rail transportation the largest source of value.
Growth rates moderated from the forceful post-Covid rebound in 2023, when 39% growth was recorded, to 3%. The number of rail passengers increased 11.9% year-on-year.
The largest source of growth was investment in rail infrastructure, increasing 11% year-on-year. China added 3,000km of new railway line in 2024, with the total length of operating railways reaching 162,000km. This includes the Shanghai-Suzhou-Huzhou high-speed rail line, which opened at the end of the year.
Another 12,000km of high-speed rail will be opened by 2030. The goal is to establish a nationwide “1-2-3-hour travel circle”, where travel between cities within the same metropolitan area takes one hour, travel between adjacent cities takes two hours, and travel between major cities takes three hours.
Realising this vision involves connecting China’s entire coastline through a 350km per hour route by 2028, and to create a grid of eight east-to-west and north-to-south high-speed trunk lines.
Electricity grids and storage
Electricity transmission and storage was responsible for 9% of the total value of the clean-energy sectors in 2024, with real growth of 19%.
The most valuable sub-segment was investment in power grids, followed by investment in energy storage. This includes spending on pumped hydropower, grid-connected battery storage and hydrogen production. The transmission of clean power also increased an estimated 17%, due to rapid growth in clean power generation.
China’s installed electricity storage capacity growth rivaled the increase in coal- and gas-fired power generation capacity, for the first time on record.
A total of approximately 50GW of battery storage, pumped hydro and hydrogen production capacity was added, while fossil fuel-based power generation capacity increased by 54GW.
This is significant, because a key rationale for building coal- and gas-fired power plants has been capacity adequacy, where electricity storage facilities can supplant the need for fossil fuel-based capacity.
Almost 40GW of battery storage was added, increasing 70% year-on-year and reaching 74GW total grid-connected capacity.
The operating capacity of pumped hydropower reached 59GW, with 8GW added during the year and 30GW entering construction. Capacity under construction increased to 189GW, up 13% on year, indicating that capacity additions will accelerate substantially in the next few years.
Investment in hydrogen electrolyser projects doubled year-on-year, from 1.8GW in 2023 to 3-4GW in 2024.
By the end of 2024, China had 42 operational long-distance, ultra-high voltage transmission lines, with a total length of over 40,000km and transmission capacity exceeding 300GW. Another 12 lines are under construction.
One of the headline transmission projects completed during the year is an ultrahigh voltage transmission line connecting regions of Inner Mongolia and northern Hebei with large amounts of renewable and coal power, to demand centers in Beijing, Tianjin, Hebei, Shandong and Jiangsu provinces.
Investment in transmission and storage is bound to continue. China’s top economic planner the National Development and Reform Commission (NDRC), published a new power system action plan that aims to integrate more than 200GW of new wind and solar onto the grid per year in 2025-27, requiring significant investments in storage and transmission.
“Developing new forms of energy storage” was included in China’s government work report for the first time in 2024, signaling a stronger policy push for energy storage deployment.
Energy efficiency
Investment in energy efficiency, as measured by the aggregate turnover of large energy service companies (ESCOs) grew 4% year-on-year, the slowest growth rate among the sectors we track.
China’s energy and emissions policies have de-emphasised energy efficiency in recent years. Controlling total energy consumption and energy intensity – so-called energy dual control – was the centerpiece of China’s energy policy and climate commitments until the early 2020s, creating strong incentives for provinces and enterprises to improve energy efficiency.
The policy was re-jigged in 2023 to target reductions in the fossil fuel intensity of the economy, making clean energy a more attractive way for local governments to pursue the targets. Five-year plan targets for building energy efficiency retrofits were also lowered compared with the previous plan.
Role of cleantech manufacturing in emissions growth
The clean-energy sectors include energy-intensive manufacturing industries, particularly the production of batteries and polysilicon, a key raw material for solar panels.
In addition, electric vehicles, solar panels and wind turbines need energy-intensive raw materials such as aluminum, steel and glass.
For this reason, and due to the high public profile of these industries, many commentators have suggested that the manufacturing of clean energy technologies is a major driver of China’s energy demand growth and emissions.
In reality, however, their role in driving China’s emissions is limited. The production of the “new three” – EVs, batteries and solar – was responsible for an estimated 3.5% of China’s CO2 emissions and 0.9 percentage points of emissions growth in 2024
In addition, the analysis shows that these sectors contributed just 0.5 percentage points out of the overall 6.8% increase in China’s electricity demand in 2024.
Electric vehicle charging used an additional 0.8% of China’s total electricity consumption, making it responsible for approximately 0.3% of the country’s total CO2 emissions.
For a full accounting, these additional emissions from producing and fuelling clean energy technologies would need to be compared with the CO2 savings from using them instead of fossil-fuelled alternatives, such as coal-fired power stations or combustion-engine cars.
Falling prices boost adoption, but challenge producers
While almost all other economies fret over high inflation, China is struggling with deflation, a product of aggressive expansion of manufacturing and weak domestic demand.
Several key clean-energy industries are facing this issue, with supply gluts leading to weak revenue and profits growth despite growing volumes. Attention on this issue has masked the contribution of the industries to real growth.
In the manufacturing of solar panels, for example, the nominal value of the industry’s production fell by 41%, even as volumes showed strong growth.
Yet, the nominal value of investments in solar-power projects held steady as the volume of the projects increased strongly and the price of solar panels only makes up less than one third of the cost of solar-power generation projects.
The value of electricity generated from solar increased by 40%, pulling the overall contribution of the solar power industry to nominal GDP growth into positive territory.
In total, the value added of the clean energy industries grew an estimated 8.5% in nominal terms, slower than the 15% real growth rate but significantly faster than the growth rate of GDP, contributing 17% of nominal GDP growth.
In December 2024, a key annual economic policy meeting called for the creation of a “healthy environment for the development of green and low-carbon industries” industries. This suggests the government may introduce measures to address excess clean manufacturing supply and address the weak profitability of the sector.
Implications of rapidly growing clean-energy economy
For the second year in a row, clean-energy sectors played an indispensable role in meeting China’s key economic targets.
The combination of iIncreased supply and falling prices is leading to much faster deployment in China than practically anyone expected a few years ago and is also catalysing clean energy deployment in new overseas markets.
This growth is expected to continue into 2025, driven by major projects aiming to finish before the end of the current five-year plan.
Beyond 2025, development of China’s clean-energy sectors hinges on new targets and policies in the next five-year plan, covering 2026-2030, which is being finalised this year.
After the lightning capacity expansion of the past few years, clean-energy manufacturing is plagued by weak profitability and oversupply.
Returning the sectors to profitability would require both maintaining strong domestic demand and measures to address overcapacity. Grid constraints, particularly affecting solar power, would need to be resolved to sustain demand.
Early indications of the targets proposed by China’s key ministries for 2030 and 2035 fall short of maintaining the demand for key clean-energy technologies at the 2023–24 level.
Setting targets for the next five-year period that are below the current rate of deployment could turn the clean-energy sectors from a driver of GDP growth into a drag, as well as worsening the oversupply situation they are facing. In contrast, ambitious clean energy targets could maintain the sector’s positive contribution to the economy.
The government’s economic stimulus measures are likely to support investment in the clean-energy sectors, given their significant role in investment growth.
Moreover, the now critical role of clean-energy development in driving China’s economic expansion creates incentives for policymakers to ensure the economic health of the sector.
About the data
Reported investment expenditure and sales revenue has been used where available. When this is not available, estimates are based on physical volumes – gigawatts of capacity installed, number of vehicles sold – and unit costs or prices.
The contribution to real growth is tracked by adjusting for inflation using 2022–2023 prices. For 2024, the contribution to nominal growth – not adjusted for inflation – is estimated by either using nominal values directly, when reported, or adjusting real growth rates by reported year-on-year changes in prices or costs.
All calculations and data sources are given in a worksheet.
Estimates include the contribution of clean energy technologies to the demand for upstream inputs such as metals and chemicals.
This approach shows the contribution of the clean-energy sectors to driving economic activity, also outside the sectors themselves, and is appropriate for estimating how much lower economic growth would have been without growth in these sectors.
Double counting is avoided by only including non-overlapping points in value chains. For example, the value of EV production and investment in battery storage of electricity is included, but not the value of battery production for the domestic market, which is predominantly an input to these activities.
Similarly, the value of solar panels produced for the domestic market is not included, as it makes up a part of the value of solar power generating capacity installed in China. However, the value of solar panel and battery exports is included.
The estimates are likely to be conservative in some key respects. For example, Bloomberg New Energy Finance estimates “investment in the energy transition” in China in 2024 at $800bn. This estimate covers a nearly identical list of sectors to ours, but excludes manufacturing – the comparable number from our data is $600bn.
China’s National Bureau of Statistics says that the total value generated by automobile production and sales in 2023 was 11tn yuan. The estimate in this analysis for the value of EV sales in 2023 is 2.3tn yuan, or 20% of the total value of the industry, while EVs already made up 31% of vehicle production, and the average selling prices for EVs are slightly higher than for internal combustion engine vehicles.


