Analysis: China’s CO2 falls 1% in Q2 2024 in first quarterly drop since Covid-19
Lauri Myllyvirta
08.08.24Lauri Myllyvirta
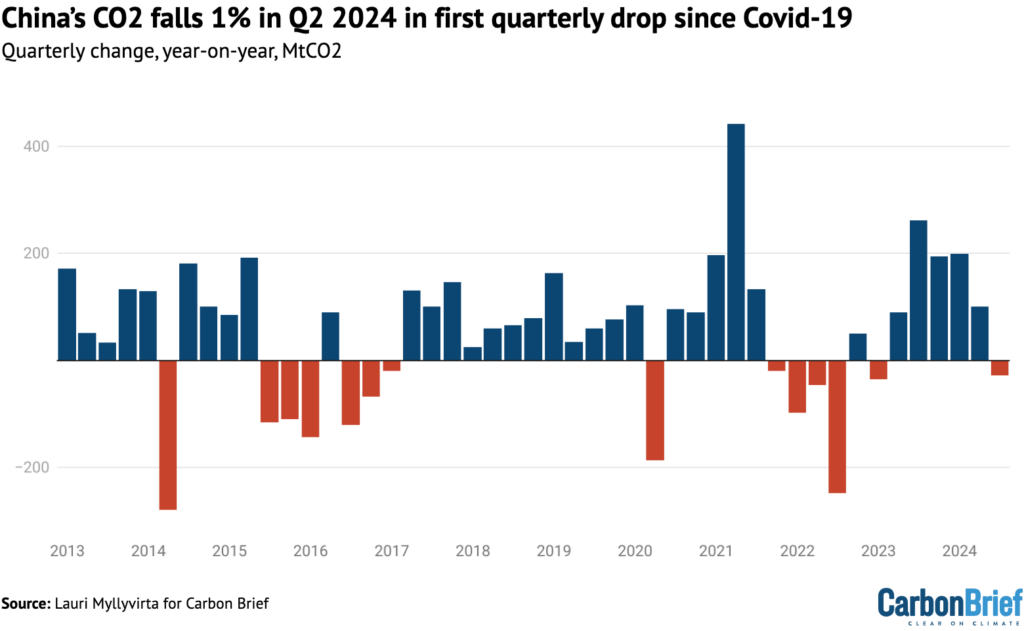
08.08.2024 | 12:01amChina’s carbon dioxide (CO2) emissions fell by 1% in the second quarter of 2024 in the first quarterly fall since the country re-opened from its “zero-Covid” lockdowns in December 2022.
The new analysis for Carbon Brief, based on official figures and commercial data, shows China remains on track for a decline in annual emissions this year.
This annual outlook depends on electricity demand growth easing in the second half of the year, as expected in projections from sector group the China Electricity Council.
However, if the latest trends in energy demand and supply continue – in particular, if demand growth continues to exceed pre-Covid trends – then emissions would stay flat in 2024 overall.
Other key findings from the analysis include:
- China’s energy demand grew by 4.2% year-on-year in the second quarter of 2024. This is slower than the growth seen in 2023 and in the first quarter of this year, but is still much higher than the pre-Covid trend.
- CO2 emissions from energy use and cement production fell by 1% in the second quarter. When combined with a sharp 6.5% increase in January-February and a monthly decline in March, there was a 1.3% rise in CO2 emissions across the first half of the year, compared with the same period in 2023.
- Electricity generation from wind and solar grew by 171 terawatt hours (TWh) in the first half of the year, more than the total power output of the UK in the same period of 2023.
- China’s carbon intensity – its emissions per unit of GDP – only improved by 5.5%, well short of the 7% needed to meet the country’s intensity target for 2025.
- This was despite a one-off boost from China’s hydropower fleet recovering from drought.
- Compared with a year earlier, the increase in the number of electric vehicles (EVs) on China’s roads cut demand for transport fuels by approximately 4%.
- Manufacturing solar panels, EVs and batteries was only responsible for 1.6% of China’s electricity consumption and 2.9% of its emissions in the first half of 2024.
A slew of recent policy developments, summarised below, hint at a renewed focus in Beijing on the country’s energy and climate targets.
Yet the precise timing and height of China’s CO2 emissions peak, as well as the pace of subsequent reductions, remain key uncertainties for global climate action.
First post-Covid fall in CO2
China’s CO2 emissions fell by 1% in the second quarter of 2024, the first quarterly fall since the country re-opened from zero-Covid, as shown in the figure below.
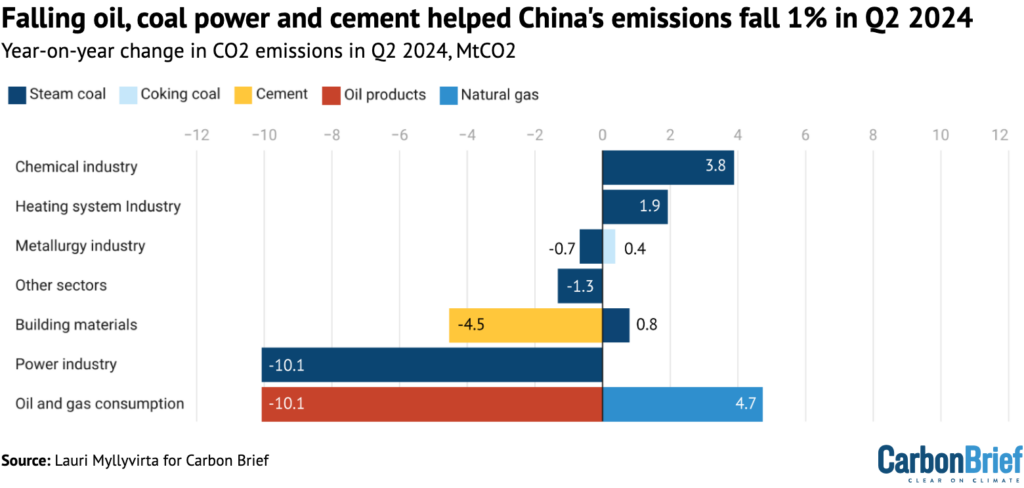
Within the overall total, power sector emissions fell by 3%, cement production fell by 7% and oil consumption by 3%.
The reduction in CO2 emissions was driven by the surge in clean energy additions, which is driving fossil fuel power into reverse. (See: Clean energy additions on track to top 2023 record.)
However, rapid energy demand growth in sectors such as coal-to-chemicals diluted the impact of changes in the electricity sector. (See: Rapid energy demand growth.)
Clean energy additions on track to top 2023 record
The additions of new clean power capacity in China have continued to boom this year.
China added 102 gigawatts (GW) of new solar and 26GW of wind in the first half of 2024, as shown in the figure below. Solar additions were up 31% and wind additions up 12% compared with the first half of last year, so China is on track to beat last year’s record installations.
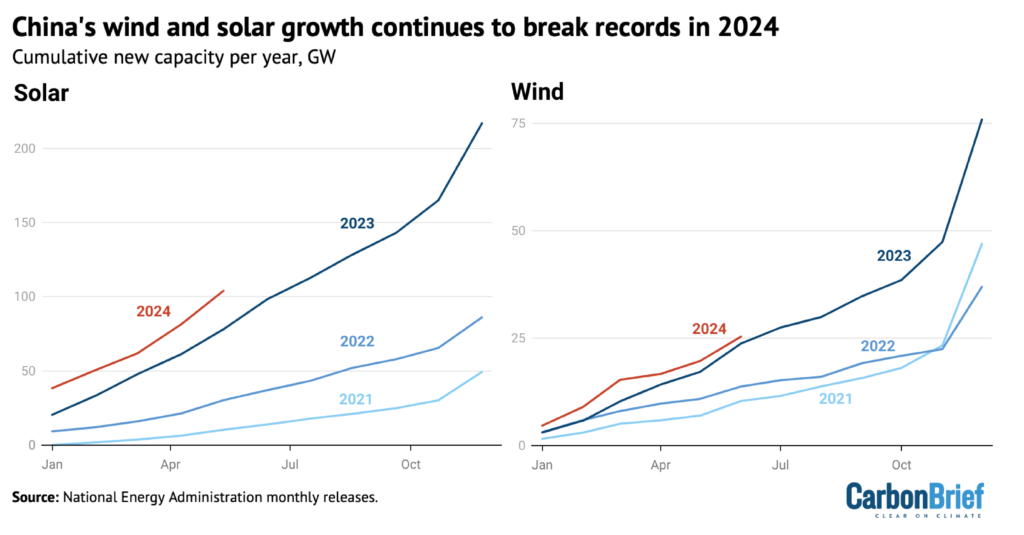
As a result of the strong capacity growth – and despite poor wind conditions – solar and wind covered 52% of electricity demand growth in the first half of 2024 and 71% since March. (The fall in wind speeds can be seen from NASA MERRA-2 data averaged for all of China.)
Indeed, the increase in power generation from solar and wind reported by the National Energy Administration in the first half of the year, at 171 terawatt hours (TWh), exceeded the UK’s total electricity supply of 160TWh in the first half of 2023.
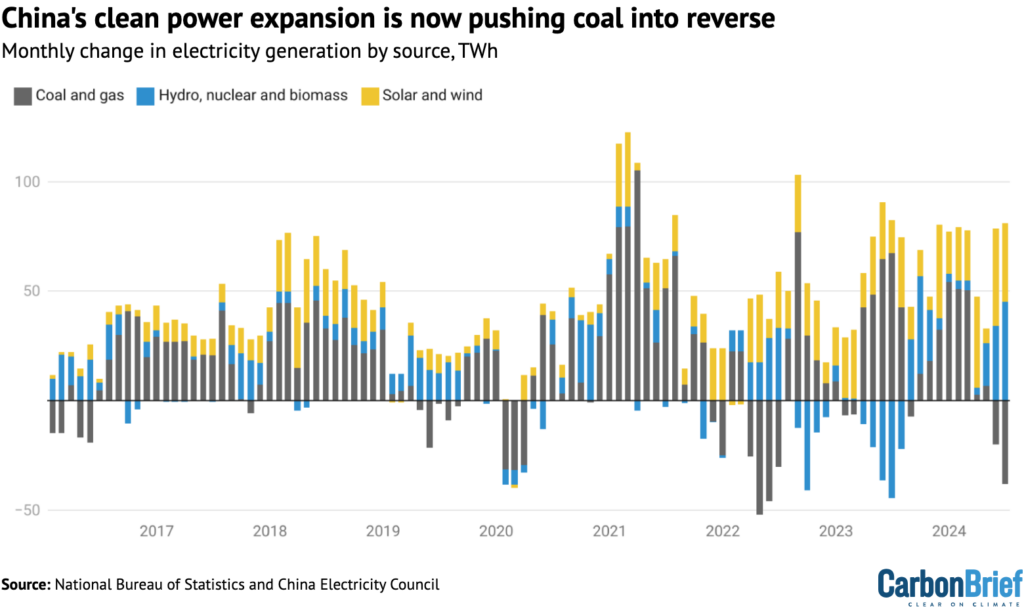
Rapid demand growth in January–February, at 11%, had outpaced even the clean energy additions. But combined with a rebound in hydropower generation, the increase in non-fossil electricity supply exceeded power demand growth in the March to June period.
These shifts are shown in the figure below, illustrating how clean power expansion started to exceed electricity demand growth in recent months, pushing coal and gas power into reverse.
After stopping the publication of capacity utilisation data by technology in May, the National Energy Administration released data in July on power generation by technology for renewable sources – solar, wind, hydro and biomass.
The NEA’s data shows renewable electricity generation covering 35% of demand in the first half of 2024 and growing 22% year-on-year. This is much higher than the previously-published National Bureau of Statistics numbers – which under-report wind and particularly solar power generation – but is closely aligned with estimates previously published by Carbon Brief.
In terms of other clean energy technologies, the production of electric vehicles, batteries and solar cells – the so-called “new-three” due to their recently acquired economic significance – continued to grow strongly in the first half of the year, at 34%, 18% and 37%, respectively.
This growth in production indicates strong demand from China and overseas. The growth of solar cell production halted in June, however.
Rapid energy demand growth
While clean technologies continue to surge in China, energy consumption has also continued to grow at a fast rate relative to GDP. This indicates that the energy-intensive growth pattern that China followed during zero-Covid is continuing.
In the second quarter of 2024, total energy consumption increased by 4.2%, while GDP grew by 4.7%, marking an energy intensity gain of only 0.5%. This energy demand growth is much faster than the pre-Covid trend.
China’s target is an annual improvement of 2.9%, a rate that was exceeded consistently until Covid-era economic policies shifted the country’s growth pattern. Economic growth during and after zero-Covid has been reliant on energy-intensive manufacturing industries.
The main structural drivers of recent energy consumption growth were the coal-to-chemicals industry, and industrial demand for power and gas.
The coal-to-chemicals industry produces petrochemical products from coal instead of oil, supporting China’s energy security goals but at a great cost to climate goals, as the coal-based production processes have far higher carbon footprints.
China’s energy security drive and falling coal prices relative to oil prices have driven a boom in this industry. When coal supply was tight in 2022–23, the government was controlling coal use by the chemical industry to increase supply to power plants. As the coal supply situation has eased in 2024, this has enabled coal-to-chemicals plants to increase production, with coal consumption in the chemical industry growing 21% in the first half of the year.
Gas consumption increased 8.7% in the first half of the year, with industrial and residential gas consumption rising strongly, even as power generation from gas fell. Residential demand was driven up by extreme cold in the winter, however, rather than by structural factors.
On the flipside, the demand for oil products continued to fall, with a 3% drop in the second quarter that accelerated in the summer.
There are multiple factors driving the reduction: the shift to electric vehicles is contributing to the drop, with the share of EVs in cumulative vehicle sales over the past 10 years – an indicator of the mix of vehicles on the road – reaching 11.5% in June, up from 7.7% a year ago. This means that the increase in EVs cut the demand for transport fuels by approximately 4%.
The ongoing contraction in construction volumes, which is apparent in the fall in cement production, also affects oil demand, as the construction sector is a major source of demand for oil products for freight and machinery.
Another key driver is weak demand for oil as a petrochemical feedstock, which the rapidly increasing coal-to-chemicals production attempts to displace with the use of coal, albeit at a cost of increased CO2 emissions.
The contraction in construction volumes, caused by a slowdown in real estate that began in 2021, is weighing on the demand for cement and steel. Besides the direct effect of less real estate construction, local government revenues are dragged down by a fall in land sales, affecting their ability to spend on infrastructure construction.
These changes in demand for energy can been seen in the figure below, which shows contributions to the change in China’s CO2 emissions in the second quarter of this year.
While CO2 emissions did fall in the second quarter, the rate of CO2 intensity improvements fell short of the level needed to meet China’s 2025 carbon intensity commitment.
The country’s goal is to reduce emissions relative to GDP by 18% from 2020 to 2025, with progress until 2023 falling far short of the target.
As reported GDP growth slowed to 4.7% in the second quarter, and CO2 emissions fell by 1%, CO2 intensity improved by 5.5%, short of the 7% annual improvement needed in 2024-25 to get back on track.
Improvements are also easier to achieve this year than they will be in 2025, as the rebound of hydropower from the low availability in 2022–23 helps reduce emissions. This is a one-off tailwind that is not likely to be present in 2025.
One part of the energy-intensive industry that China has been relying on to drive economic growth is the manufacturing of clean energy technologies. In response, some commentators have exaggerated the CO2 impact of Chinese factories making solar panels, EVs and batteries.
In reality, however, the manufacturing of these goods was responsible for 1.6% of China’s electricity consumption and 2.9% of its emissions in the first half of 2024, based on calculations using publicly available data.
The same calculations show that their CO2 emissions and electricity consumption increased by approximately 27% in the same period, contributing a 0.6% increase in China’s total fossil CO2 emissions and 0.4% increase in electricity consumption.
Looking ahead to the rest of this year, energy consumption growth is expected to cool. The China Electricity Council projects electricity demand growth of 5% in the second half of the year, compared with 8.1% in the first half, and the National Energy Administration expects full-year gas demand growth to moderate to 6.5–7.7%, from 8.7% in the first half.
If these projections are accurate, then the continued growth of clean energy consumption would be sufficient to push China’s CO2 emissions into decline this year.
However, the faster-than-expected energy demand growth in the first half of the year dilutes the emission reductions from the country’s record clean energy additions, and adds uncertainty to whether China’s emissions will indeed fall in 2024 compared with 2023.
If the growth rates of energy demand, by fuel and sector, seen in the second quarter of this year continue into the third and fourth quarter, with similar continuity in the growth rates of non-fossil electricity generation, then China’s emissions would stay flat in 2024 overall.
Recent policy developments
Energy consumption growth could also be moderated by a renewed policy focus on energy and climate targets. In May of this year, the State Council, China’s top administrative body, issued an action plan on energy conservation and CO2 emission reductions in 2024–25.
This plan is notable both for the unusual time period, covering the last two years of the five-year plan period, and for its high-level nature – energy conservation would normally fall under the jurisdiction of the energy and environmental regulators, rather than the State Council.
This suggests that the government recognises the shortfall against the 2025 carbon intensity and energy intensity targets. The action plan calls for meeting both of these targets, and lists numerous measures to be undertaken in response.
Yet the plan did not set numerical targets for 2024 that would be consistent with meeting the 2025 targets, which could be seen as taking a hedged approach of pushing for more action but not guaranteeing that sufficient results will be achieved.
Another State Council plan, released in late July, calls for speeding up the creation of a “dual control system” to control total CO2 emissions and emissions intensity. (Historically, China has never set numerical targets for total CO2 emissions, only aiming to limit CO2 intensity.)
According to the July release, the 15th five-year plan will set a binding carbon intensity target in the 2026-30 period, in line with previous five-year plans. For the first time, there will also be a non-binding, “supplementary” target for China’s absolute emissions level in 2030. Then, for each of the following five-year periods, there will be a binding absolute emissions target.
After the shortfall against the 2025 intensity target, the 15th five-year plan period would need to set a demanding intensity target to fulfil China’s 2030 commitments under the Paris Agreement.
The most important political meeting of the year, the “third plenum” of the Central Committee of the Communist Party, took place in July. The readout of the meeting mentioned carbon emissions reduction for the first time, but did not signal a shift to stimulating consumption. This could have driven less emissions-intensive economic growth, reducing reliance on higher-carbon manufacturing or infrastructure expansion.
The key focus of the meeting was promoting “new quality productive forces”, meaning advanced manufacturing and innovation. In practice, this likely implies a continued emphasis on manufacturing, with the potential for the energy-intensive economic growth pattern to continue.
Another indication that carbon emissions are receiving more policy emphasis is that the government appears to have stopped permitting new coal-based steelmaking projects since the beginning of 2024.
Hundreds of coal-based “replacement” projects were permitted in previous years, preparing to replace up to 40% of China’s existing steelmaking capacity with brand-new furnaces.
The shift away from new coal-based capacity is consistent with China’s target of increasing the use of electric arc furnaces – but progress towards that target had been lagging.
On coal-fired power, the government issued a new policy on “low-carbon transformation” of coal plants, aiming to initiate “low-carbon” retrofitting projects of a batch of coal power plants in 2025, with the target of reducing the CO2 emissions of those plants 20% below the average for similar plants in 2023, and another batch in 2027 aiming for emission levels 50% below 2023 average.
Under this transformation plan, emissions reductions at targeted coal plants are supposed to be achieved by “co-firing” coal with either biomass or “green” ammonia derived from renewables-based hydrogen, or by adding carbon capture, utilisation and storage (CCUS).
However, there are no targets for how many coal plants should be retrofitted, or what the incentives will be to do that, which will obviously determine the direct impact of this policy.
The impact could be small as biomass supply is limited, while the costs of ammonia and CCUS are high. For example, the International Energy Agency – among the more optimistic on power generation from biomass – sees its share rising from 2% in 2022 to 4.5% in 2035, if China meets its pledges on energy and climate IEA’s.
Furthermore, much of China’s coal-fired generation is already unprofitable, with almost half of the firms in the sector operating at a loss – even before taking on costly new measures.
The policy does however constitute Beijing’s first attempt at reconciling the recent permitting spree of new coal-fired power plants with its CO2 peaking goal for 2030, and looking for alternatives to early closure or under-utilisation of at least a part of the coal power fleet.
Prospects for a 2023 emissions peak and beyond
China’s emissions fell year-on-year in March and in the second quarter, as expected in my analysis for Carbon Brief last year.
Faster-than-expected growth in coal demand for the chemical industry, however, as well as industrial demand for power and gas, has diluted the emission reductions from the power sector, making the fall in emissions smaller than expected.
Nevertheless, China is likely still on track to begin a structural decline in emissions in 2024, making 2023 the peak year for CO2 emissions.
In order for this projection to bear out in reality, clean energy growth would need to continue and the expected cooling in energy demand growth in the second half of the year would need to materialise, with the new policy focus on energy savings and carbon emissions proving lasting.
The trends that could upset this projection include the economic policy focus on manufacturing, and the expansion of the coal-to-chemicals industry.
The surge in coal use for coal-to-chemicals is also a demonstration that even if power sector emissions begin to fall, as long as China’s climate commitments allow emissions to increase, there is the potential for developments that increase emissions in other sectors.
China has committed to updating its climate targets for 2030 and releasing new targets for 2035 early next year. These targets will be key in cementing the emissions peak and specifying the targeted rate of emission reductions after the peak – both of which have seismic implications for the global emissions trajectory and the level at which temperatures can be stabilised.
About the data
Data for the analysis was compiled from the National Bureau of Statistics of China, National Energy Administration of China, China Electricity Council and China Customs official data releases, and from WIND Information, an industry data provider.
Wind and solar output, and thermal power breakdown by fuel, was calculated by multiplying power generating capacity at the end of each month by monthly utilisation, using data reported by China Electricity Council through Wind Financial Terminal.
Total generation from thermal power and generation from hydropower and nuclear power was taken from National Bureau of Statistics monthly releases.
Monthly utilisation data was not available for biomass, so the annual average of 52% for 2023 was applied. Power sector coal consumption was estimated based on power generation from coal and the average heat rate of coal-fired power plants during each month, to avoid the issue with official coal consumption numbers affecting recent data.
When data was available from multiple sources, different sources were cross-referenced and official sources used when possible, adjusting total consumption to match the consumption growth and changes in the energy mix reported by the National Bureau of Statistics for the first quarter and the first half of the year. The effect of the adjustments is less than 1% for all energy sources, and the conclusion that emissions fell in the second quarter holds both with and without this adjustment.
CO2 emissions estimates are based on National Bureau of Statistics default calorific values of fuels and emissions factors from China’s latest national greenhouse gas emissions inventory, for the year 2018. Cement CO2 emissions factor is based on annual estimates up to 2023.
For oil consumption, apparent consumption is calculated from refinery throughput, with net exports of oil products subtracted.
-
Analysis: China’s CO2 falls 1% in Q2 2024 in first quarterly drop since Covid-19


