Worst case scenarios of sea level rise, and why scientists and policymakers consider them
Robert McSweeney
10.21.14Robert McSweeney
21.10.2014 | 5:52pmSea levels could rise by a maximum of 190 centimetres by the end of the century, according to a new study, which examines a worst case scenario for sea level rise.
In reality, the amount of sea level rise we get is likely to be less than that. But scientists and policymakers examine such ‘worst case’ scenarios to safeguard against climate risks.
Upper limit
With 10 per cent of the world’s population living less than 10 metres above sea level, the threat of coastal flooding is significant. The Intergovernmental Panel on Climate Change (IPCC) expects sea level rise to cause a ‘ significant increase‘ in sea levels extremes and the risk of coastal flooding.
The new study, published in Environmental Research Letters, considers the assessment of 13 ice sheet experts. They conclude that the contribution from ice sheets is likely to be greater than projected by the IPCC. The paper suggests that sea levels could rise by as much as 190 cm this century.
Projections of sea level rise are typically constructed by working out the contribution to sea level rise from different factors. The biggest contribution is from water expanding as it warms, followed by melting glaciers, then melting ice sheets on Greenland and Antarctica.
The crucial question for sea level rise this century is how much ice will be lost from the ice sheets, the authors argue. But it remains one of the largest uncertainties. In its Fifth Assessment Report (AR5), the IPCC says there isn’t sufficient evidence for them to give probabilities of large-scale losses of ice sheets.
The new study uses expert judgement to consider areas of ice sheet loss that are often not included in the sea level models that the IPCC bases its assessment on. They then combine these judgements with the methods used in AR5 to produce their upper-limit figure of 190 cm.
‘Likely’ range
It’s likely that sea level rise will be lower than that. In AR5, the IPCC projects sea level rise of between 26 and 82 cm by 2100. These projections are presented as a ‘likely’ range, meaning there is a 66 per cent likelihood that sea level rise will fall within this range.
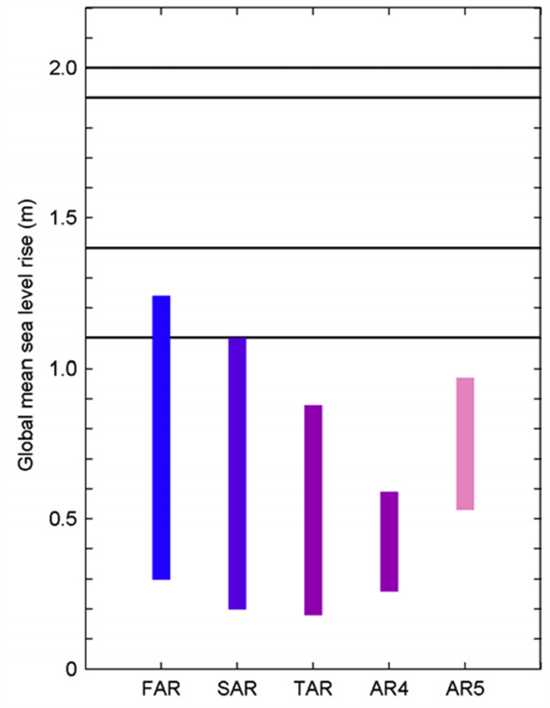
The graph below shows the projections of sea-level rise from all five IPCC Assessment Reports since the IPCC was founded in 1988, based on a ‘business as usual’ scenario where carbon emissions continue to rise.
The range of global mean sea level projections for 2100 under business-as-usual scenarios from five IPCC Assessment Reports. From the First Assessment Report (FAR) on the left to the Fifth Assessment Report (AR5) on the right. The black horizontal lines represent ‘low probability-high impact’ scenarios used in national planning assessments: 110 cm from the Delta Commission in the Netherlands, 140 cm from the Scientific Committee on Antarctic Research, 190 cm from UK Climate Projections 2009, and 200 cm from the US National Oceanic and Atmospheric Administration. Jevrejeva et al. (2014)
The projections have changed over the years as understanding of sea level changes has improved. The projection range from AR5 is higher than the Fourth Assessment Report (AR4), for example, because AR4 didn’t consider the contribution of Greenland and Antarctic ice sheets.
Flood protection
The graph also shows sea level projections used in national planning as a series of horizontal black lines. You can see how much higher these are than the IPCC ranges.
So why the difference? Worst case scenarios are necessary in planning for future climate, particularly when the potential cost of any damage is high.
The upper end of the IPCC projections is not a worst case scenario, but rather the largest rise that they consider ‘likely’.
Designers of flood protection need to be sure that they will be able to cope with more than just the ‘likely’ increase in sea levels; therefore, other scenarios have been developed to consider larger, albeit less likely changes.
In the most recent set of climate projections for the UK, for example, the Met Office produced a ‘High++’ scenario of up to 190 cm of sea level rise for just these situations. It takes into account large changes in ice sheets that could cause much larger sea level rises than the IPCC range includes.
The upper end of the High++ scenario “provides a plausible but highly uncertain and very unlikely scenario”. It’s being used in the Thames Estuary 2011 Project to assess the flood risk to London through the 21st century.
While large changes in the ice sheets are unlikely, the thinking goes that there is too much at risk to plan for only an average amount of sea level change. These scenarios are not there to worry people, but to ensure our flood protection can cope with whatever the sea might throw at us.
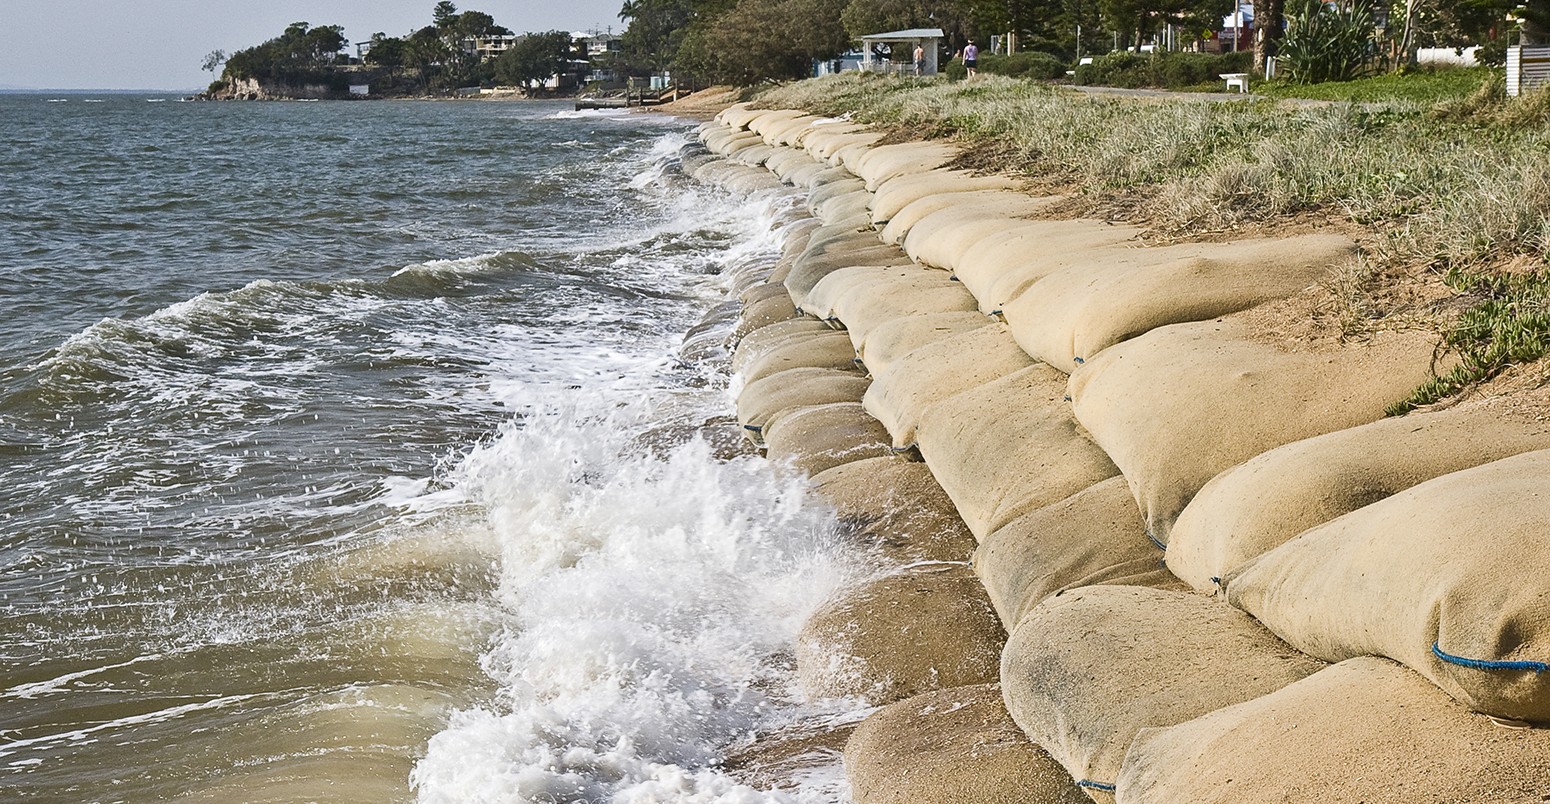
Main image: Erosion caused by rising sea levels. Credit: ribeiroantonio/Shutterstock.com.
Jevrejeva et al. (2014) Upper limit for sea level projections by 2100, Environmental Research Letters, doi:10.1088/1748-9326/9/10/104008 [This article is open-access and therefore available to download for free]
-
Worst case scenarios of sea level rise, and why scientists and policymakers consider them


