Analysis: UK emissions in 2023 fell to lowest level since 1879
Multiple Authors
03.11.24Multiple Authors
11.03.2024 | 3:59pmThe UK’s greenhouse gas emissions fell by 5.7% in 2023 to their lowest level since 1879, according to new Carbon Brief analysis.
The last time UK emissions were this low, Queen Victoria was on the throne, Benjamin Disraeli was prime minister, Mosley Street in Newcastle became the first road in the world with electric lighting and 59 people died in the Tay Bridge disaster in Dundee.
Carbon Brief’s analysis, based on preliminary government energy data, shows emissions fell to just 383m tonnes of carbon dioxide equivalent (MtCO2e) in 2023. This is the first time they have dropped below 400MtCO2e since Victorian times.
Other key findings from the analysis include:
- The UK’s emissions are now 53% below 1990 levels, while GDP has grown by 82%.
- The drop in emissions in 2023 was largely due to an 11% fall in gas demand. This was due to higher electricity imports after the French nuclear fleet recovered, above-average temperatures and weak underlying demand driven by high prices.
- Gas demand would have fallen even faster, but for a 15% fall in UK nuclear output.
- Coal use fell by 23% in 2023 to its lowest level since the 1730s, as all but one of the UK’s remaining coal-fired power stations closed down.
- Transport was the single-largest sector in terms of emissions, followed by buildings industry, agriculture and electricity generation. The electricity sector likely dropped below agriculture for the first time.
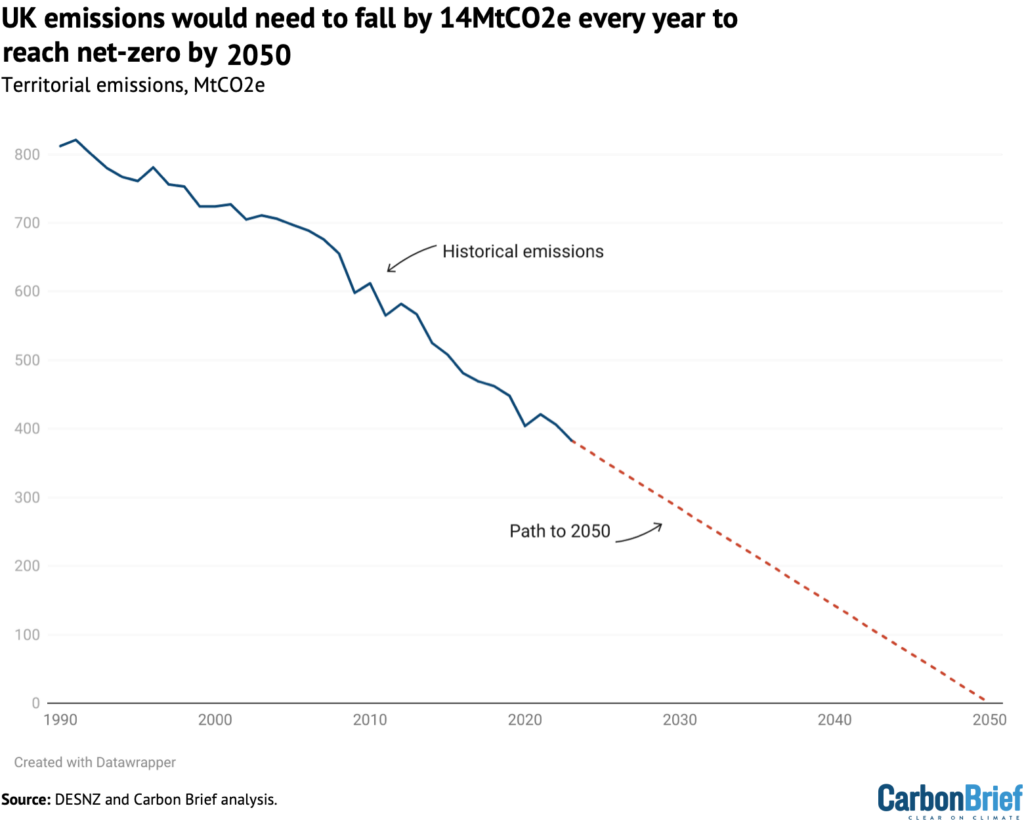
While the 23MtCO2e reduction in 2023 was faster than the 14MtCO2e per year average needed to reach net-zero by 2050, it was mostly unrelated to deliberate climate action. The UK will need to address emissions from buildings, transport, industry and agriculture to reach its 2050 target.
The analysis is the latest in a long-running series of annual estimates from Carbon Brief, covering emissions during 2022, 2020, 2019, 2018, 2017, 2016, 2015 and 2014.
Update 28/3/2024: Official provisional government estimates put the drop in UK greenhouse gas emissions in 2023 at 5.4%, compared with Carbon Brief’s 5.7%. The government said emissions fell to 384MtCO2e in 2023, very similar to Carbon Brief’s 383MtCO2e.
Lowest since 1879
The UK’s territorial greenhouse gas emissions – those that occur within the country’s borders – have now fallen in 25 of the 34 years since 1990.
(Consumption-based emissions, including CO2 embedded in imported goods and services, were increasing until 2007, but have since fallen at a similar rate to territorial emissions.)
Apart from brief rebounds after the global financial crisis and the Covid-19 lockdowns, UK emissions have fallen during every year for the past two decades.
The latest 23MtCO2e (5.7%) reduction in 2023 takes UK emissions down to 383MtCO2e, according to Carbon Brief’s new analysis.
This is the lowest since 1879 – outside the 1926 general strike – as shown in the figure below.
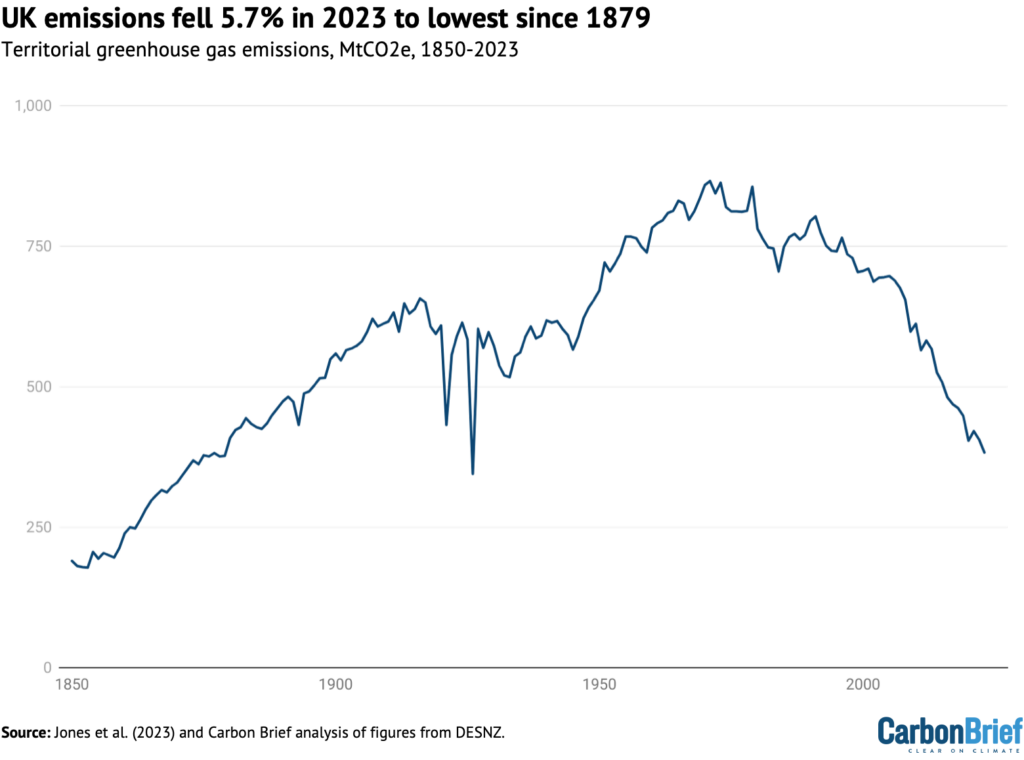
Having dropped to a then-record low for the modern era of 404MtCO2e during the height of Covid in 2020, UK emissions bounced back in 2021 as the economy reopened.
While emissions declined in 2022, they remained above 2020 levels. In 2023, however, emissions fell below the lows seen during Covid lockdowns, to levels not seen since Victorian times.
Accidental action
The biggest contributor to the drop in UK greenhouse gas emissions in 2023 was an 11% reduction in gas demand, which accounted for around two-thirds of last year’s overall decline. This took the UK’s gas demand to its lowest level since the 1980s.
However, the drop in 2023 was not primarily due to deliberate climate action.
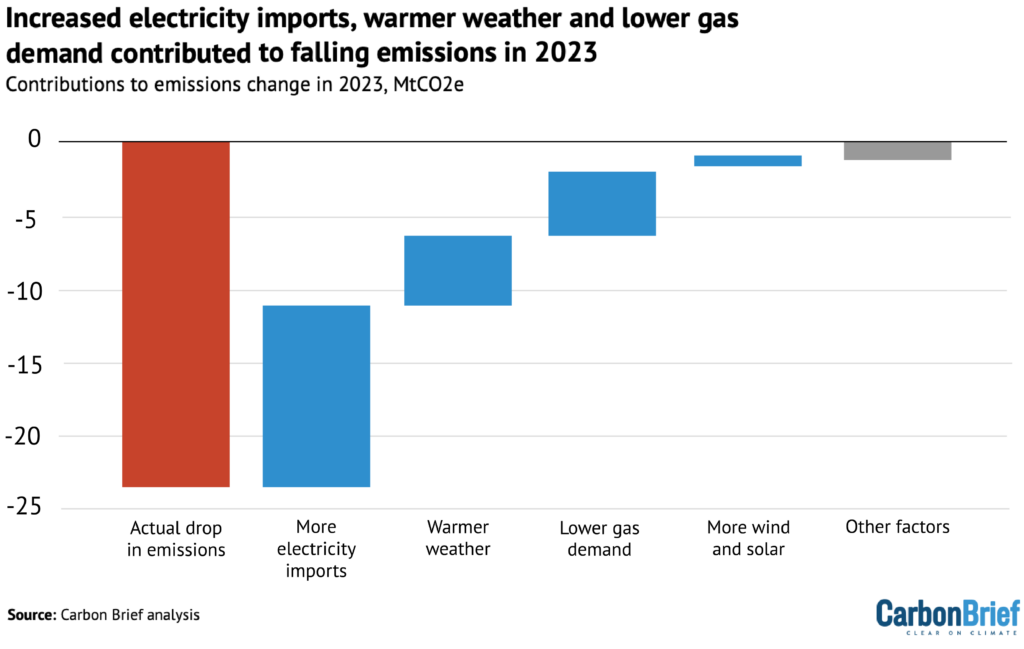
The figure below shows the estimated actual drop in emissions in red, followed by contributions from a series of factors that decreased emissions, in blue, and other factors in grey.
The most significant factor was the UK returning to its long-term position as a net electricity importer in 2023, reducing demand for domestically generated power from gas by more than 20%.
This followed an anomalous year in 2022, when the UK was a net exporter for the first time ever, as a result of widespread outages in the French nuclear fleet.
Lower demand for gas power accounted for more than two-thirds of the fall in gas use overall.
Next, above-average temperatures reduced the need for heating, while continuing very high prices since Russia’s invasion of Ukraine caused weak underlying demand for gas.
Reflecting both of these factors, there was a 6% drop in domestic demand in 2023, accounting for a fifth of the overall decline in gas consumption. A similar 7% drop in commercial demand for gas accounted for another tenth of the total, with a 5% drop in industrial demand the remainder.
Finally, the figure shows that there was a small reduction in gas demand and associated CO2 emissions as a result of increased wind and solar generation.
The impact of rising wind and solar capacity in 2023 was muted by average windspeeds being below average and the average number of sun hours falling sharply compared with 2022.
The UK’s emissions would have fallen even further in 2023 if not for a 15% decline in the output of the nation’s nuclear fleet. This followed the closure in 2022, of the Hunterston B station in Scotland and the Hinkley Point B plant in Somerset, as well as maintenance outages.
The decline in 2023 means UK nuclear output fell to the lowest level since the early 1980s. Following the site closures in 2022, the UK only has five operational nuclear power plants remaining, all but one of which – Sizewell B in Suffolk – are due to close this decade.
Out of coal
After gas, the next-largest driver of falling UK emissions in 2023 was coal, accounting for around 14% of the overall drop in emissions.
The decline of coal use in the UK – for homes, railways, factories and power stations – is a major part of the long-term reduction in greenhouse gas emissions over the past 30 years.
Factors in this long-term decline include controls on domestic coal burning to limit air pollution, the end of steam railways, the shift from coal-based “town gas” to “natural” gas from the North Sea, the deindustrialisation of the 1970s and the “dash for gas” of the 1990s.
More recently, coal demand has dropped precipitously as the rapid build-out of renewable sources of electricity has combined with falling demand and carbon pricing that favours gas.
The figure below shows how UK coal demand surged during the industrial revolution before levelling off through the 20th century, barring general strikes in 1921 and 1926.
Coal demand has been falling steadily since the passage of the Clean Air Act in 1956, in response to London’s “great smog” of 1952. In 2023, UK coal demand fell by another 23% to the lowest level since the 1730s, when George II was on the throne and Robert Walpole was prime minister.
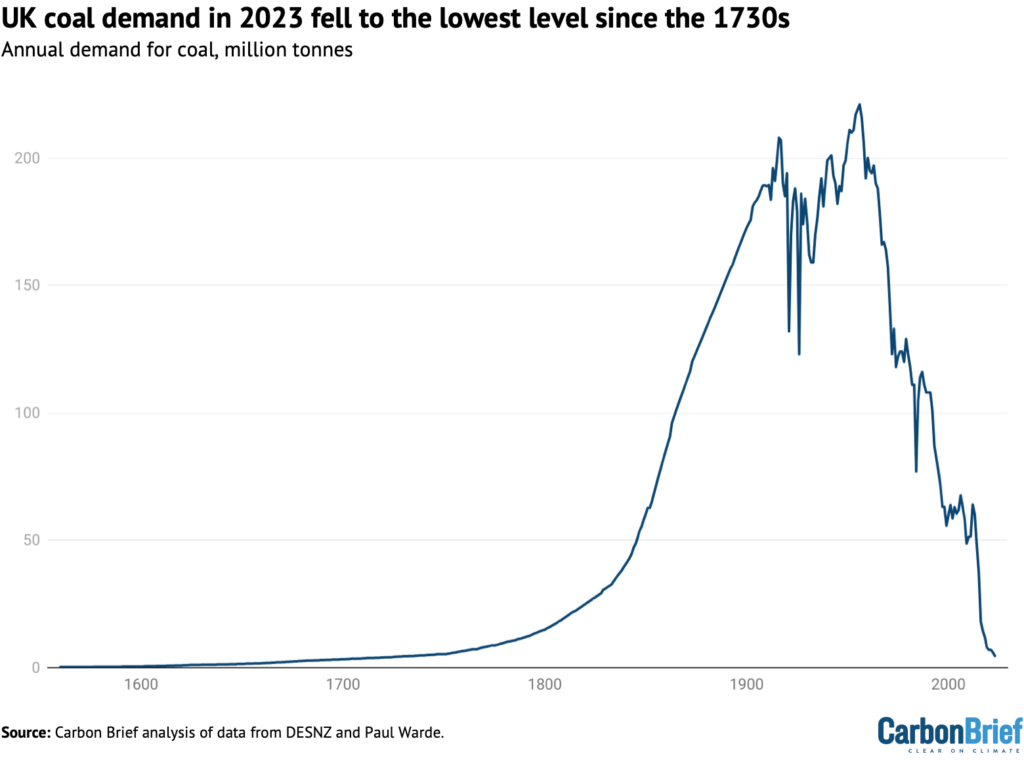
The recent reduction of coal demand is largely down to the demise of coal power, which made up around 40% of the UK’s electricity generation as recently as 2012. Coal power output has fallen by 97% over the past decade, accounting for 87% of the fall in UK coal demand overall.
In 2023, only 1% of the UK’s electricity came from coal, with three coal-fired plants closing down: the coal units at Drax in Yorkshire; Kilroot in Northern Ireland; and West Burton A in Lincolnshire.
As of the start of October 2023, only one coal plant remains – the Ratcliffe-on-Soar site in Nottinghamshire. Operator Uniper plans to close Ratcliffe in September 2024, ahead of the government’s deadline to end coal power by October 2024.
Sectoral shifts
The reductions in gas use for power and building heat, as well as the fall in coal use for power, further cemented the transport sector as the largest contributor to UK emissions in 2023.
This is shown in the figure below, which highlights how transport emissions have barely changed over the past several decades as more efficient cars have been offset by increased traffic.
The power sector was the largest contributor to the UK’s emissions until 2014. In 2023, it was likely only the fifth-largest below transport, buildings, industry and – for the first time – also agriculture.
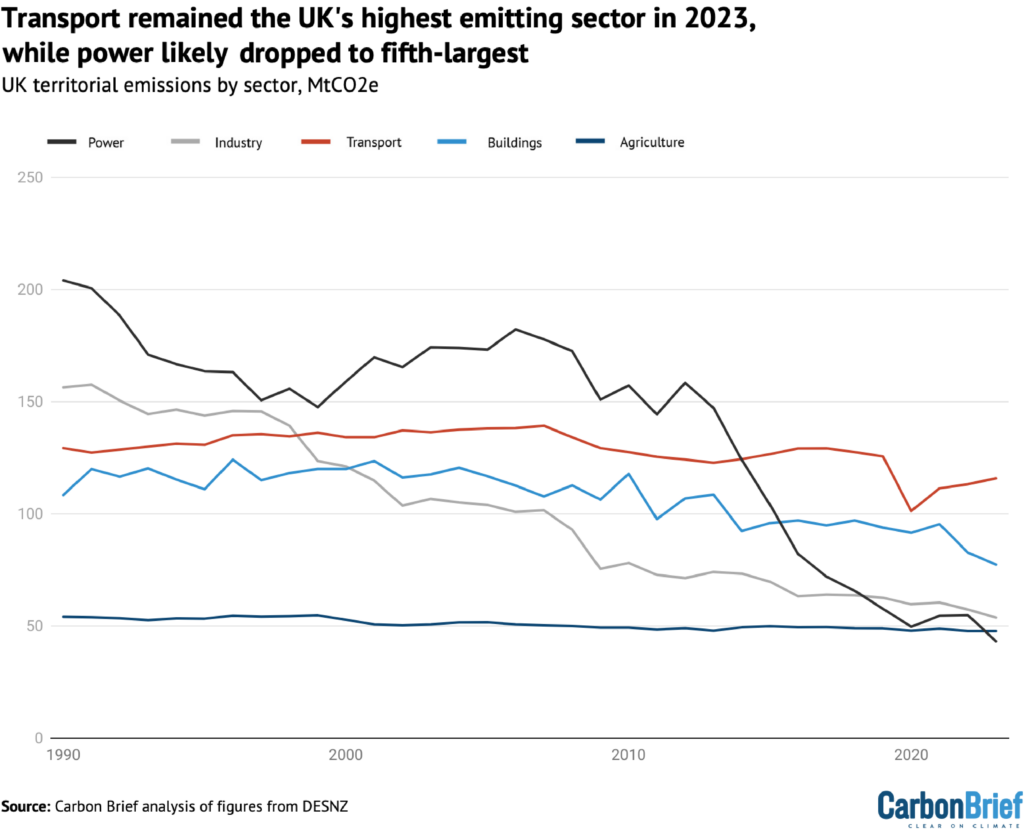
As of 2023, transport emissions were only around 10% below 1990 levels and made up nearly a third of the UK’s overall total. There are now more than a million electric vehicles (EVs) on the UK’s road, which will have avoided around 2MtCO2e of annual emissions.
However, the government has also frozen or cut fuel duty every year since 2010, rather than increasing it in line with inflation, adding up to around 20MtCO2e to the UK’s total.
Emissions from buildings – chiefly for heating and cooling – are the second-largest contributor to the UK’s emissions, accounting for around a fifth of the total.
They were around one-third lower than 1990 levels in 2023, with improved insulation and boiler regulations making the UK’s buildings more efficient to heat.
Efficiency improvements dried up around a decade ago and the fall in building emissions since 2021 has been driven by high prices suppressing demand, rather than deliberate policy choices.
Industrial emissions made up an estimated tenth of the UK’s total in 2023, having fallen by two-thirds since 1990 and by a quarter in the past decade.
In common with many other developed economies, the UK shifted from heavy industry towards advanced manufacturing and services from the 1970s onwards. However, industrial energy efficiency improvements and a shift to lower-carbon fuels are also part of the picture.
Agricultural emissions have barely changed for decades, making up just over a tenth of the UK’s total in 2023 and having fallen just 12% since 1990 as livestock herds have shrunk.
There was a small decrease in farm emissions in 2022 as the energy crisis filtered through into surging prices for fertilisers. For the figure above, Carbon Brief assumes the reduced fertiliser use in 2022 continued in 2023, as fertiliser prices only eased in summer 2023.
Decoupling emissions
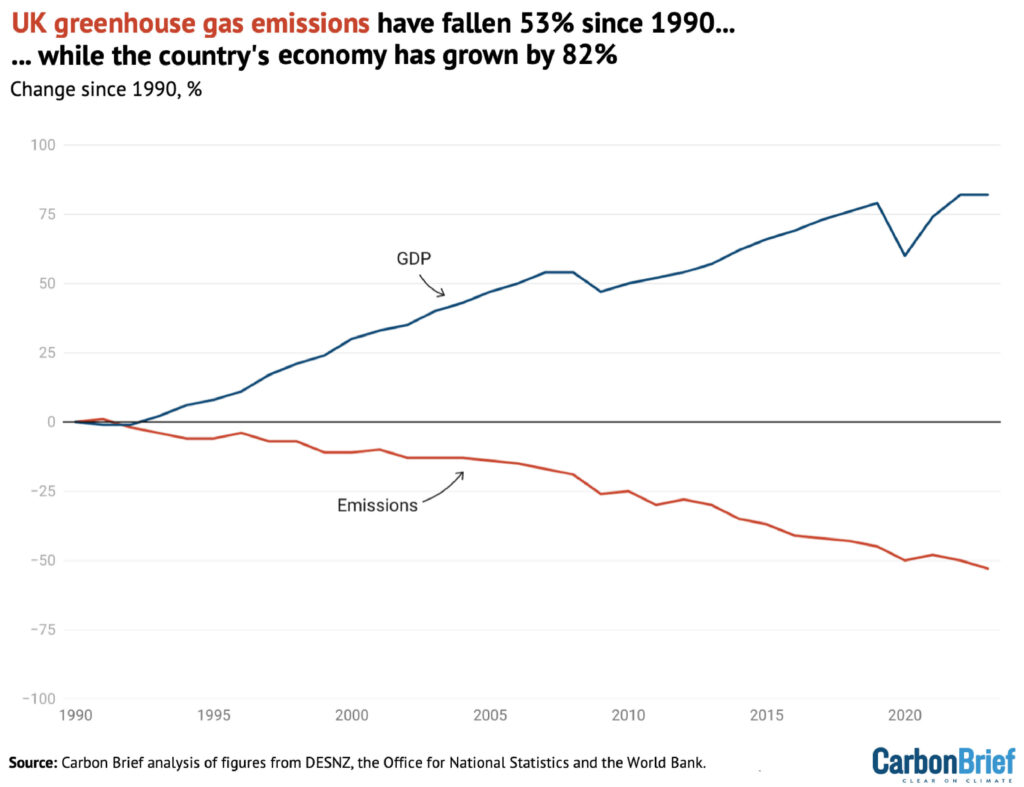
The drop in UK emissions in 2023 came as the economy flatlined, growing by just 0.4% on 2022 levels. The UK’s emissions are now 53% below 1990 levels while the economy has grown 82%.
This “decoupling” of emissions from economic growth is shown in the figure below. As noted above, this analysis is based on territorial emissions within the UK’s borders.
Consumption-based emissions including imported goods and services were climbing in the early part of this century. However, emissions cuts over the past two decades have been very largely driven by sectors that cannot easily be “outsourced”, particularly power and building heat.
The UK is now in a mild recession and the economy is only expected to grow by around 1% in 2024. Recent trends in the “emissions intensity” of the UK economy – the emissions per unit of GDP – and weak economic growth suggests that emissions could continue to fall in 2024.
On the other hand, gas and oil prices are easing to pre-crisis levels, while above-average temperatures may not continue for another year. Petrol demand rose by nearly 5% in 2023 as traffic continued to rebound from the pandemic – and jet fuel use similarly climbed by 16%.
Moreover, the one-off impact of the UK returning to net electricity imports has now unwound. As such, further emissions cuts in 2024 are far from guaranteed.
Target practise
While the UK has made rapid progress in cutting its territorial emissions since 1990, it remains only around halfway to reaching its net-zero target for 2050, as the chart figure shows.
Emissions fell by 23MtCO2e in 2023, according to Carbon Brief’s analysis. This is faster than the 14MtCO2e reduction needed every year for the next quarter-century to reach net-zero by 2050.
However, with only one coal-fired power station remaining and the power sector overall now likely only the fifth-largest contributor to UK emissions, the country will need to start cutting into gas power and looking to other sectors, if it is to continue making progress towards its targets.
This will mean expanding wind and solar capacity to reduce gas use, while retaining gas-fired power stations for periods of low wind and starting to build low-carbon alternatives, such as gas with carbon capture and storage, long-term energy storage or hydrogen-fired turbines.
Emissions from road transport and buildings will be key areas if the UK is to progress, which is why changes to government plans around electric vehicles and heat pumps could be problematic.
Similarly, a government decision to “carry forward” the “surplus” emissions cuts from earlier years – largely due to external events such as Covid – would severely weaken UK targets at a time when continued ambition is needed, to stay on track for medium- and long-term climate goals.
Methodology
The starting point for Carbon Brief’s analysis of UK greenhouse gas emissions is preliminary government estimates of energy use by fuel. These are published quarterly, with the final quarter of each year appearing in figures published at the end of the following February. The same approach has accurately estimated year-to-year changes in emissions in previous years (see table, below).
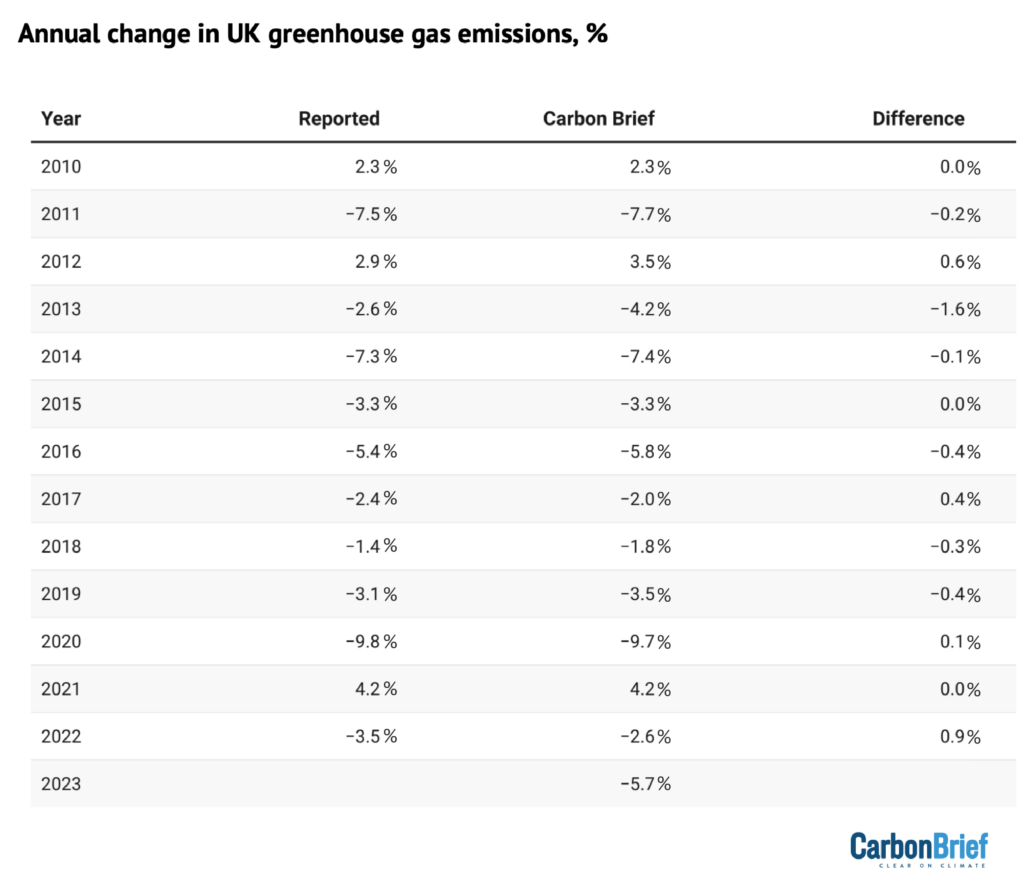
One large source of uncertainty is the provisional energy use data, which is revised at the end of March each year and often again later on. Emissions data is also subject to revision in light of improvements in data collection and the methodology used, with major revisions in 2021.
The table above applies Carbon Brief’s emissions calculations to the comparable energy use and emissions figures, which may differ from those published previously.
Another source of uncertainty is the fact that Carbon Brief’s approach to estimating the annual change in emissions differs from the methodology used for the government’s own provisional estimates. The government has access to more granular data not available for public use.
Carbon Brief’s analysis takes figures on the amount of energy sourced from coal, oil and gas reported in Energy Trends 1.2. These figures are combined with conversion factors for the CO2 emissions per unit of energy, published annually by the UK government. Conversion factors are available for each fuel type, for example, petrol, diesel, gas, coal for electricity generation.
For oil, the analysis also draws on Energy Trends 3.13, which further breaks down demand according to the subtype of oil, for example, petrol, jet fuel and so on. Similarly, for coal, the analysis draws on Energy Trends 2.6, which breaks down solid fuel use by subtype.
Emissions from each fuel are then estimated from the energy use multiplied by the conversion factor, weighted by the relative proportions for each fuel subtype.
For example, the UK uses roughly 50m tonnes of oil equivalent (Mtoe) in the form of oil products, around half of which is from road diesel. So half the total energy use from oil is combined with the conversion factor for road diesel, another one-fifth for petrol and so on.
Energy use from each fossil fuel subtype is mapped onto the appropriate emissions conversion factor. In some cases, there is no direct read-across, in which case the nearest appropriate substitute is used. For example, energy use listed as “bitumen” is mapped to “processed fuel oils – residual oil”. Similarly, solid fuel used by “other conversion industries” is mapped to “petroleum coke”, and “other” solid fuel use is mapped to “coal (domestic)”.
The energy use figures are calculated on an inland consumption basis, meaning they include bunkers consumed in the UK for international transport by air and sea. In contrast, national emissions inventories exclude international aviation and shipping.
The analysis, therefore, estimates and removes the part of oil use that is due to the UK’s share of international aviation. It draws on the UK’s final greenhouse gas emissions inventory, which breaks emissions down by sector and reports the total for domestic aviation.
This domestic emissions figure is compared with the estimated emissions due to jet fuel use overall, based on the appropriate conversion factor. The analysis assumes that domestic aviation’s share of emissions is equivalent to its share of jet fuel energy use.
In addition to estimating CO2 emissions from fossil fuel use, Carbon Brief assumes that CO2 emissions from non-fuel sources, such as land-use change and forestry, are the same as a year earlier. Remaining greenhouse gas emissions are assumed to change in line with the latest government energy and emissions projections.
These assumptions are based on the UK government’s own methodology for preliminary greenhouse gas emissions estimates, published in 2019.
Note that the figures in this article are for emissions within the UK measured according to international guidelines. This means they exclude emissions associated with imported goods, including imported biomass, as well as the UK’s share of international aviation and shipping.
The Office for National Statistics (ONS) has published detailed comparisons between various different approaches to calculating UK emissions, on a territorial, consumption, environmental accounts or international accounting basis.
The UK’s consumption-based CO2 emissions increased between 1990 and 2007. Since then, however, they have fallen by a similar number of tonnes as emissions within the UK.
Bioenergy is a significant source of renewable energy in the UK and its climate benefits are disputed. Contrary to public perception, however, only around one quarter of bioenergy is imported.
International aviation is considered part of the UK’s carbon budgets and faces the prospect of tighter limits on its CO2 emissions. The international shipping sector has a target to at least halve its emissions by 2050, relative to 2008 levels.